. 2010 Nov 3;30(44):14759-72.
doi: 10.1523/JNEUROSCI.4036-10.2010.

Reelin signals through apolipoprotein E receptor 2 and Cdc42 to increase growth cone motility and filopodia formation

Affiliations

Reelin signals through apolipoprotein E receptor 2 and Cdc42 to increase growth cone motility and filopodia formation

Jost Leemhuis et al. J Neurosci. .

Abstract

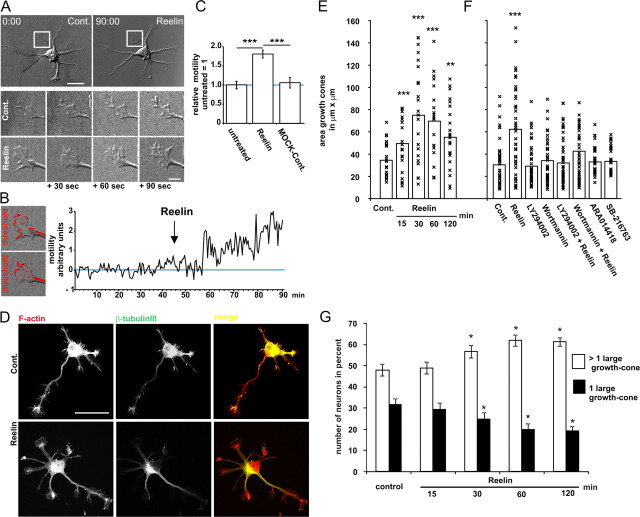
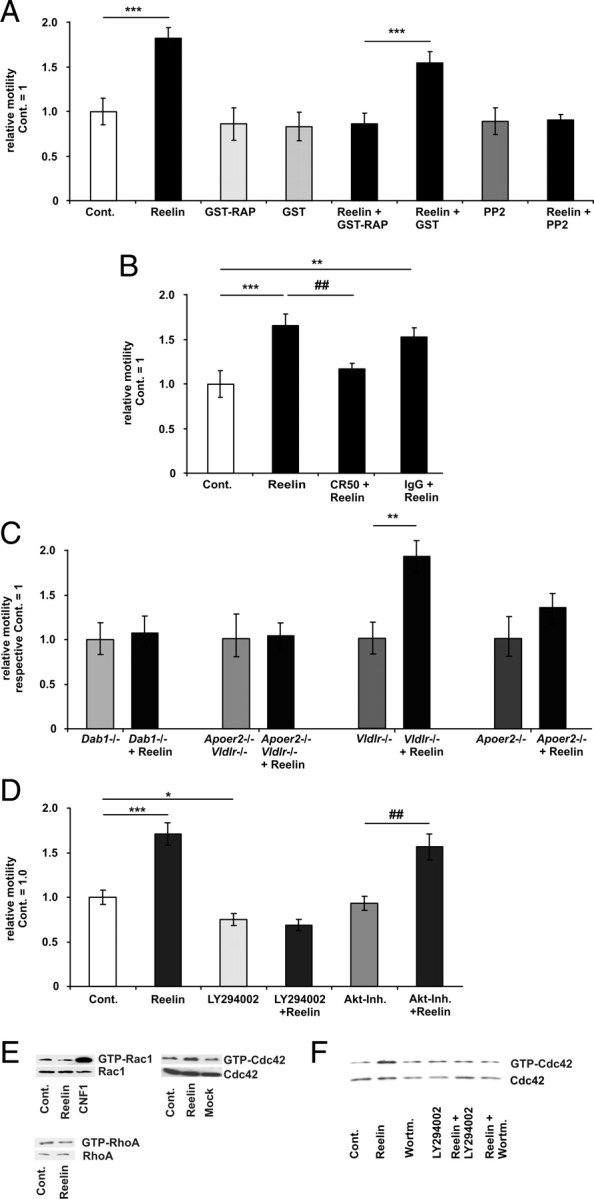
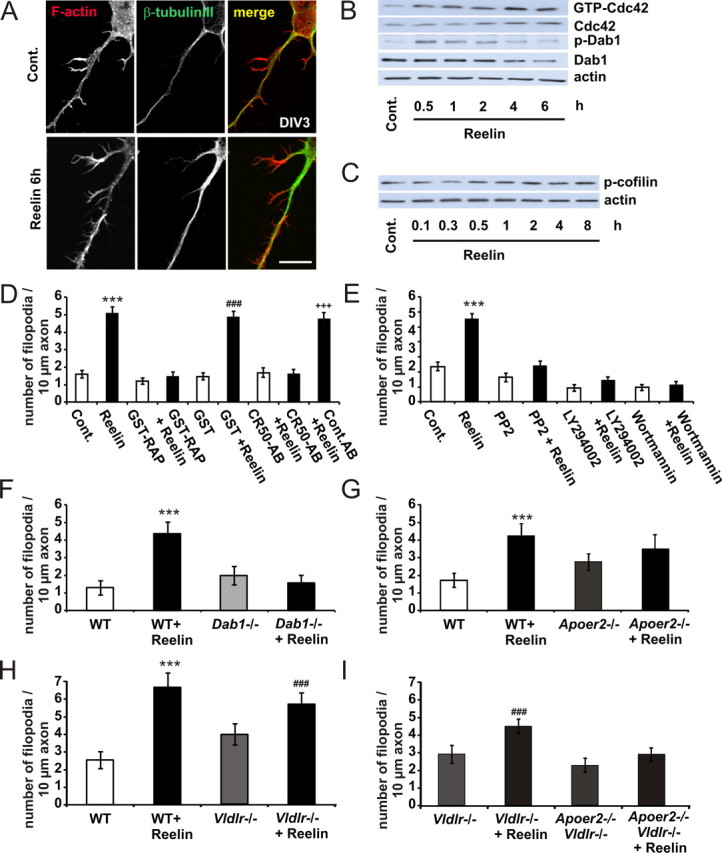
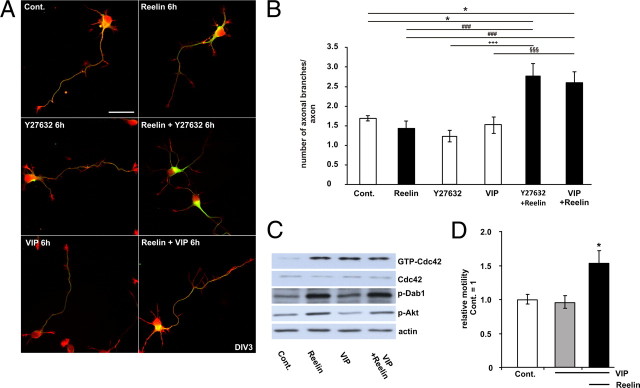
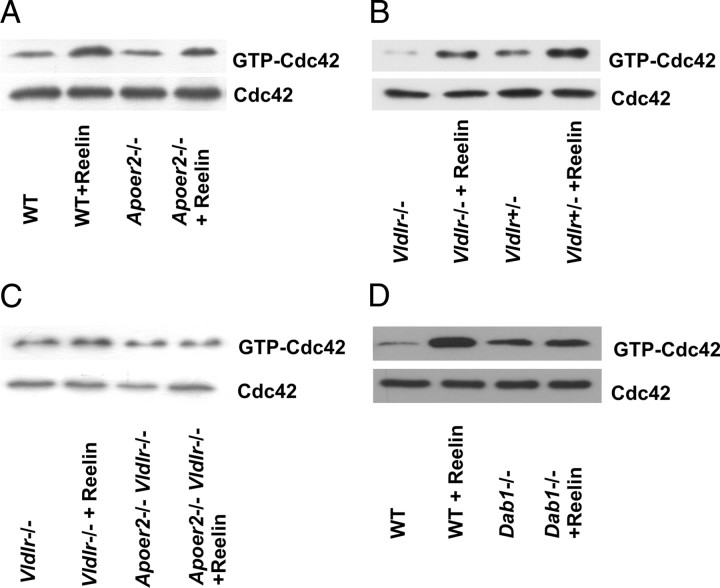
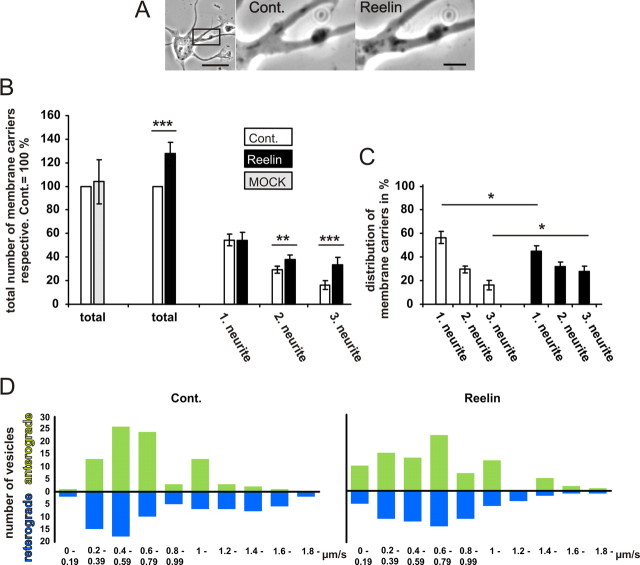
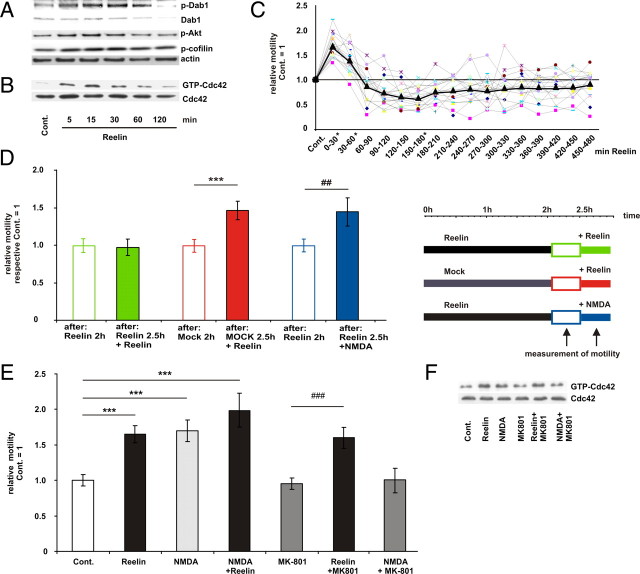
Lipoprotein receptor signaling regulates the positioning and differentiation of postmitotic neurons during development and modulates neuronal plasticity in the mature brain. Depending on the contextual situation, the lipoprotein receptor ligand Reelin can have opposing effects on cortical neurons. We show that Reelin increases growth cone motility and filopodia formation, and identify the underlying signaling cascade. Reelin activates the Rho GTPase Cdc42, known for its role in neuronal morphogenesis and directed migration, in an apolipoprotein E receptor 2-, Disabled-1-, and phosphatidylinositol 3-kinase-dependent manner. We demonstrate that neuronal vesicle trafficking, a Cdc42-controlled process, is increased after Reelin treatment and further provide evidence that the peptidergic VIP/PACAP38 system and Reelin can functionally interact to promote axonal branching. In conclusion, Reelin-induced activation of Cdc42 contributes to the regulation of the cytoskeleton of individual responsive neurons and converges with other signaling cascades to orchestrate Rho GTPase activity and promote neuronal development. Our data link the observation that defects in Rho GTPases and Reelin signaling are responsible for developmental defects leading to neurological and psychiatric disorders.


Figures

Figure 1.
Figure 1.
Reelin induces neurite motility. A, Time-lapse DIC microscopy of a stage-II mouse cortical neuron derived from a wild-type brain E15.5, DIV1, 16 h after plating, before (Cont.) and after bath application of ∼5 nm Reelin. Images were taken at 30 s intervals. Exemplarily, four subsequent micrograph images of a growth cone within the middle of the control period and four subsequent micrographs within the middle of the Reelin treatment period are shown. B, For quantification, all images of a stack (supplemental Movie 1, available at www.jneurosci.org as supplemental material) were binarized by thresholding and pixel differences were analyzed automatically using MetaMorph software. C, The calculated relative motility of untreated neurons was set as “1.” Supernatants of vector (MOCK-control) transfected HEK293 cells induced no additional growth cone motility. Means ± SEM; n ≥ 6; ***p < 0.001 vs untreated or MOCK-controls. D–G, Effects of Reelin on growth cone morphology. Neurons were treated with Reelin for 30 min and stained for F-actin and β-tubulin III (scale bar, 20 μm) (D) or (E) for the indicated times. The areas of the growth cones, representing the distal 15 μm of the neurites, were determined using the MetaMorph software. Pooled data from three individual experiments were plotted; bars represent mean (n = 50; **p < 0.01, ***p < 0.001 vs controls). F, Neurons were treated with Reelin, the GSK3b inhibitors ARA014418 and SB-216763 for 30 min, LY294002, or wortmannin were added 30 min before the treatment with Reelin. Bars represent mean (n = 50; ***p < 0.001 vs controls). G, Percentage of neurons with one (black columns) or more (white columns) axon-like growth cones with a fanned morphology (means ± SEM; n = 12 quantifications of different coverslips, *p < 0.05 vs controls).
Figure 2.
Figure 2.
Reelin stimulates motility via Apoer2 and Cdc42. A, The motility of WT neurons was determined before and after bath application of ∼5 nm Reelin, GST-RAP, GST, Reelin, PP2, or in combination as indicated. The relative motilities of the control (Cont.) periods of each treatment group were set as 1 and were compared with the respective treatment periods. Means ± SEM; n ≥ 6; ***p < 0.001 vs control; ###p < 0.001 vs GST-RAP. B, Before the addition of Reelin, Reelin was preincubated with the Reelin-neutralizing CR-50 antibody or control mouse IgG antibody at a concentration of 200 μg/ml. Means ± SEM; n ≥ 6; ***p < 0.001, **p < 0.01 vs control; ##p < 0.01 vs Reelin. C, The motility of Dab1−/−, Apoer2−/−, Vldlr−/−, and Vldlr−/− and Apoer2−/− (double knock-out) neurons was determined before and after bath application of Reelin. Means ± SEM; n ≥ 6; **p < 0.01 vs Vldlr−/−. D, The motility of WT neurons was determined before and after bath application of Reelin, LY294002, Akt inhibitor (Akt-Inh.) VIII, or in combination, as indicated (means ± SEM; n ≥ 6, *p < 0.05, ***p < 0.001 vs controls; ##p < 0.01 vs Akt-Inh.). E, WT neurons were treated with Reelin (15 min). Afterward GTP-Rac1 or GTP-Cdc42 levels were determined by a PAK-CRIB and GTP-RhoA levels by a mDia1 pull-down assay. As a positive control for Rac activation, we applied the Rac1 activating E. coli cytotoxic necrotizing factor 1 (CNF1 toxin). F, WT neurons were treated with Reelin (15 min), wortmannin (45 min), or Reelin was present during the last 15 min of wortmannin treatment (45 min). GTP-Cdc42 was determined with a PAK-CRIB pull-down assay.
Figure 3.
Figure 3.
Reelin induces axonal filopodia. A, Neurons were treated with ∼0.5 nm Reelin for 6 h and stained for F-actin and β-tubulin III. Scale bar, 10 μm. B, In cortical neurons, Reelin enhanced the GTP binding of Cdc42 in a time-dependent manner, as determined by PAK-CRIB pull-down experiments. Protein levels of tyrosine-phosphorylated Dab1 detected with the anti-p-tyrosine-antibody 4G10, total Dab1, and actin in cellular lysates from control (Cont.)- or Reelin-treated neurons were measured by immunoblotting. C, Neurons were treated with Reelin for up to 8 h. Protein levels of Ser3-phosphorylated n-cofilin and actin in cellular lysates from control- or Reelin-treated neurons were measured by immunoblotting. D, E, Axonal filopodia formation of WT neurons was determined with or without bath application of Reelin, GST-RAP, GST, CR50, IgG (D), and PP2, LY294002, and wortmannin (E), or in combination, as indicated. Means ± SEM; n ≥ 30; ***p < 0.001 vs controls; ###p < 0.001 vs GST; +++p < 0.001 vs CR50-AB. F–I, Filopodia formation of Dab1−/− (F), Apoer2−/− (G), Vldlr−/− (H), and Vldlr−/−, Apoer2−/− (double knock-out; here, Vldlr−/− act as “controls” because double knock-out mice are bred on a Vldlr−/− background) (I) was determined with or without bath application of Reelin (means ± SEM; n ≥ 30; ***p < 0.001 vs WT; ###p < 0.001 vs Vldlr−/−).
Figure 4.
Figure 4.
A, Reelin as matrix induces morphological changes. Neurons were cultured on striped matrix of Reelin and control stripes for 36 h. Neurons were partially located on the Reelin stripe as visualized with the Reelin antibody G10 (green) and on the control stripes (scale bar, 10 μm). Axons growing on the Reelin stripe have longer axons and show more filopodia. B, Higher magnification of the F-actin staining of the Reelin stripe; between the two green lines, for better visualization of the axonal filopodia without the Reelin-staining (scale bar, 10 μm). C, Quantification of axonal length, total length of minor processes, axonal filopodia, minor processes, and minor process filopodia. Means ± SEM; n ≥ 27; **p < 0.01 vs controls. D, Reelin activates Cdc42 in organotypic rat hippocampal slices cultures. Slice cultures were treated with Reelin (30 min); afterward GTP-Cdc42 levels were determined by a PAK-CRIB pull-down assay. As input control, actin and Cdc42 were determined by Western blot. Contr., Control; proc., process.
Figure 5.
Figure 5.
The peptidergic VIP/PACAP38 system and Reelin functionally interact to promote axonal branching. A, B, Effects of ∼0.5 nm Reelin, the Rho kinase inhibitor Y27632 and VIP on the F-actin and microtubular cytoskeleton in cortical neurons. A, Neurons were treated at DIV3 for 6 h with Reelin, Y27632, and VIP, or the respective combinations. Neurons were stained for F-actin and β-tubulin III. Scale bar, 10 μm. B, The numbers of β-tubulin-positive axonal braches were quantified. Means ± SEM; n ≥ 50; *p < 0.05 vs controls; ###p < 0.001 vs Reelin; +++p < 0.001 vs Y27632; §§§p < 0.001 vs VIP. C, Neurons were treated with Reelin (30 min), VIP (30 min), or VIP and Reelin. Afterward, GTP-Cdc42 levels were determined by a PAK-CRIB pull-down assay. Protein levels of tyrosine-phosphorylated Dab1 were measured with the anti-p-tyrosine antibody 4G10, phosphorylated Akt were measured with a serine 473-phosphorylated Akt antibody and actin in cellular lysates from control, and treated neurons were measured as an input control. D, The motility of neurons was determined before and after bath application of VIP and after the additional application of Reelin, as indicated (means ± SEM; n ≥ 5; *p < 0.05 vs controls or VIP). Cont., Control.
Figure 6.
Figure 6.
Reelin activates Cdc42 via Apoer2. A–D, GTP-bound Cdc42 was determined after 15 min of treatment with Reelin in neuronal cultures (DIV6-7) from Apoer2−/− (A), Vldlr−/− (B), Vldlr−/−, and Apoer2−/− and Vldlr−/− (double knock-out) (C), and from Dab1−/− mice (D).
Figure 7.
Figure 7.
Reelin activates Cdc42-dependent cellular motility. A, Activity of Cdc42 in a motile neuron was visualized by using FRET (Raichu-Cdc42). YFP/CFP ratio images were calculated to represent FRET efficiency (normalized EA), which is not identical to but is correlated with the activities of Cdc42 (top). The YFP stacks were used to determine motility in parallel over time (bottom). B, To demonstrate the increase of Cdc42 activity, which is associated with neurite motility, four different time points are presented in A (blue lines, I-IV) and in B. The corresponding movie of the stack is presented in supplemental Movie S5, available at www.jneurosci.org as supplemental material. Experiments were performed at least five times and similar results were obtained. C, EAs in distal neurites were averaged from two time intervals of 5 min, 15 min after the addition of Mock or Reelin (means ± SEM; n ≥ 6; **p < 0.01 vs Mock). D, Effects of Wiskostatin and Secramine on Reelin-induced motility. The motility of WT neurons was determined before and after bath application of Reelin, Wiskostatin, Secramine, or in combination, as indicated (means ± SEM; n ≥ 6; **p < 0.01 vs controls; #p < 0.05 vs Reelin). Cont., Control.
Figure 8.
Figure 8.
Reelin increases vesicle traffic. A, Traffic of vesicles and membrane compartments in all neurites was imaged by phase-contrast microscopy. Images were collected every second over a 3 min interval (see also supplemental Movie S6, available at www.jneurosci.org as supplemental material). Scale bars: left, 10 μm; right, 2 μm. B, The numbers of membrane carriers traveling within 3 min through a defined neurite segment were counted for all neurites. Numbers were sorted according to the number of membrane carriers counted during the control period. In control neurons, the first column represents the traffic in the axon, which is defined as the neurite with the most intense traffic. The total number per neuron of the control period was set as 100% and was compared with a 3 min interval of the same neuron 15 min after addition of Reelin (means ± SEM; n = 20; **p < 0.01; ***p < 0.001 vs controls). C, To compare the relative distribution of membrane carriers between axons (1.00 neurite) and dendrites (2.00 and 3.00 neurites), both the total number of vesicles of the Reelin period and the control period were set as 100% (means ± SEM; n = 20; *p < 0.05 vs controls). D, Frequency distribution of the velocities of the membrane carriers were measured. One hundred fifty or more membrane carriers were tracked for each condition, and the speed of anterograde or retrograde transport was measured. The overlapping peaks in the frequency distribution diagrams show that there is no significant change in the distribution of velocities measured in control neurons and Reelin-treated neurons. Cont., Control.
Figure 9.
Figure 9.
Dab1 degradation limits Reelin-dependent neurite motility. A, Cultured cortical neurons were treated with Reelin for up to 120 min. Protein levels of tyrosine-phosphorylated Dab1 detected with the anti-p-tyrosine-antibody 4G10, total Dab1, serine 473-phosphorylated Akt, Ser3-phosphorylated cofilin, and actin in cellular lysates from control- or Reelin-treated neurons were measured by immunoblotting. B, In cortical neurons, Reelin enhances the GTP binding of Cdc42, as determined by PAK-CRIB pull-down experiments in a time-dependent manner (upper lanes). Respective inputs are shown in the lower lanes. C, Reelin regulates neurite motility in a time-dependent manner. Neurite motility of cortical neurons was determined after bath application of Reelin over 480 min. The relative motility before Reelin application was set as 1. Afterward, motility was measured in 30 min intervals. Means ± SEM; n = 15 different neurons from n = 5 different neuronal cultures; *p < 0.05 vs controls. D, Reelin did not desensitize neurites to other motility stimuli. Cortical neurons were pretreated for 120 min with Reelin or MOCK. Afterward, neurite motility was determined over a 30 min interval, and relative motility was set as 1. After bath application of Reelin or NMDA (10 μm), the relative motility of the same neurons was measured again. Means ± SEM; n ≥ 6; ***p < 0.001 vs after: Mock 2 h; ##p < 0.01 vs after: Reelin 2 h). E, Reelin induces growth cone motility independently of NMDAR. The motility of WT cortical neurons (DIV1-2) was determined before and after bath application of Reelin, NMDA, MK801, or in combination, as indicated (means ± SEM; n ≥ 6, ***p < 0.001 vs controls; ###p < 0.001 vs MK-801). F, WT cortical neurons were treated (15 min) with Reelin, NMDA, MK801, or in combination, as indicated; afterward, GTP-Cdc42 levels were determined by a PAK-CRIB pull-down assay. GTP-bound Cdc42 is shown in the upper lanes, and total Cdc42 in the lower lanes. Cont., Control.

Similar articles

Cited by

References

    1. Arnaud L, Ballif BA, Förster E, Cooper JA. Fyn tyrosine kinase is a critical regulator of disabled-1 during brain development. Curr Biol. 2003a;13:9–17. - PubMed
    1. Arnaud L, Ballif BA, Cooper JA. Regulation of protein tyrosine kinase signaling by substrate degradation during brain development. Mol Cell Biol. 2003b;23:9293–9302. - PMC - PubMed
    1. Assadi AH, Zhang G, Beffert U, McNeil RS, Renfro AL, Niu S, Quattrocchi CC, Antalffy BA, Sheldon M, Armstrong DD, Wynshaw-Boris A, Herz J, D'Arcangelo G, Clark GD. Interaction of reelin signaling and Lis1 in brain development. Nat Genet. 2003;35:270–276. - PubMed
    1. Ayala R, Shu T, Tsai LH. Trekking across the brain: the journey of neuronal migration. Cell. 2007;128:29–43. - PubMed
    1. Ballif BA, Arnaud L, Arthur WT, Guris D, Imamoto A, Cooper JA. Activation of a Dab1/CrkL/C3G/Rap1 pathway in Reelin-stimulated neurons. Curr Biol. 2004;14:606–610. - PubMed

Publication types

MeSH terms

LinkOut - more resources