

doi: 10.1523/JNEUROSCI.1161-10.2010.
Behavioral and cerebellar transmission deficits in mice lacking the autism-linked gene islet brain-2
Affiliations
- PMID: 21048139
- PMCID: PMC3200367
- DOI: 10.1523/JNEUROSCI.1161-10.2010
Item in Clipboard
Behavioral and cerebellar transmission deficits in mice lacking the autism-linked gene islet brain-2
J Neurosci.
.
Abstract
Deletion of the human SHANK3 gene near the terminus of chromosome 22q is associated with Phelan-McDermid syndrome and autism spectrum disorders. Nearly all such deletions also span the tightly linked IB2 gene. We show here that IB2 protein is broadly expressed in the brain and is highly enriched within postsynaptic densities. Experimental disruption of the IB2 gene in mice reduces AMPA and enhances NMDA receptor-mediated glutamatergic transmission in cerebellum, changes the morphology of Purkinje cell dendritic arbors, and induces motor and cognitive deficits suggesting an autism phenotype. These findings support a role for human IB2 mutation as a contributing genetic factor in Chr22qter-associated cognitive disorders.
Figures

Generation of IB2−/− mice. A, Segment of mouse chromosome 15 spanning IB2 gene. The 90 kbp genomic region shows IB2 flanked by ChkB, ARSA, and SHANK3 genes. This region is syntenic with human 22q13.3 near the chromosomal terminus. B, Maps of a 15.7 kbp EcoRI (RI) mouse genomic segment spanning the IB2 gene (IB2+ allele), the same region after introduction of loxP sites within introns II and VIII (IB2flox allele), and the region after CRE-mediated loxP-targeted excision (IB2− allele). The 12 IB2 exons (thick black boxes) and the PGKneo selection cassette introduced by gene targeting (white/gray box) are indicated, along with the 5′ probe used in Southern blot genotyping and the positions of four primers (arrowheads) used in PCR genotyping. C, Southern blot hybridization with 5′ probe against EcoRI-digested DNA from an IB2+/flox mouse and from an IB2+/− mouse arising after CRE-mediated excision in a IB2+/flox zygote. D, Ethidium bromide-stained DNA in gel showing PCR genotyping of progeny arising from an IB2+/− intercross. E, RT-PCR analysis of brain RNA from IB2+/+ and IB2−/− mice shows retention of neighboring gene expression in mutant mice.
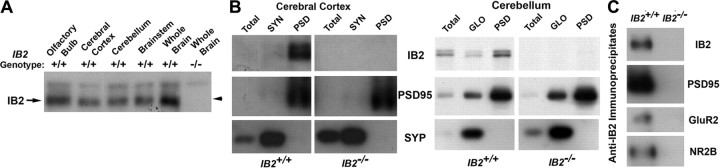
Broad distribution and synaptic enrichment of IB2 protein. A, Immunoblot detection of IB2 in mouse brain. Triton X-100-soluble extracts from whole brain or brain regions of IB2+/+ and IB2−/− mice were electrophoresed and immunoblotted, probing with monoclonal antibody to IB2. IB2 protein running with apparent molecular weight of 150,000 is expressed in all examined regions. B, IB2 enrichment in postsynaptic densities. Homogenates from IB2+/+ and IB2−/− cerebral cortex (left) or cerebellum (right) were used to prepare synaptosomes (SYN) or glomeruli (GLO), respectively, each of which was then used to extract PSDs. Equal amounts of protein from all fractions were analyzed by immunoblotting for IB2, PSD-95, and synaptophysin (SYP). PSDs from IB2+/+ cortical synaptosomes and cerebellar glomeruli are enriched for IB2 and PSD-95. C, Coimmunoprecipitation of IB2 and other PSD proteins. Whole-brain Triton X-100-soluble extracts from IB2+/+ and IB2−/− mice were immunoprecipitated with anti-IB2 and then immunoblotted with antibodies to IB2, PSD-95, AMPAR subunit GluR2, or NMDAR subunit NR2B. All of these PSD proteins coimmunoprecipitated with IB2 from the IB2+/+ extract.

IB2−/− mice are less socially interactive. Pairs of IB2+/+ or IB2−/− male (A, B) or female (C, D) mice (mixed background) were placed in a large new cage and monitored over 10 min for social interaction, judged as close pursuit or physical contact with sniffing. IB2−/− pairs engaged in significantly less total interaction time (A, C), which for males was attributed to shorter duration of interaction per contact (B). Behaviors are illustrated in supplemental Movie 1 (available at www.jneurosci.org as supplemental material).

IB2−/− mice show impaired motor performance and learning. IB2+/+ and IB2−/− mice were tested for baseline motor performance and learning on an accelerating rotarod for 4 consecutive days and scored for rod revolution speed at time of fall-off. Data are shown for males of mixed background (A), females of mixed background (B), and females of 129/SvEv background (C). For all cohorts, IB2+/+ mice performed better at initial testing than IB2−/− mice, and only IB2+/+ mice improved significantly over the 4 d testing period. D, Grip strength of IB2+/+ and IB2−/− female mice on 129/SvEv background. Forepaw grip strength while resisting pull-off from sensor bar was monitored between 3 and 5 weeks of age. IB2−/− animals showed mildly delayed strength acquisition, but did not differ significantly from IB2+/+ mice by week 5.

Ultrastructurally and molecularly normal synapses in IB2−/− mice. A–D, Electron micrographs of synapses in cerebellar granule layers (A, B) and molecular layers (C, D) of IB2+/+ (A, C) and IB2−/− (B, D) animals. Synapses (arrows) in IB2−/−cerebellum appear normal. gl, Glomerulus; d, dendritic spine; pft, parallel fiber terminal; ds, Purkinje dendritic spine. Scale bar, 500 nm. E, F, Immunoblot detection of glutamate receptor subunit enrichment in cerebral cortical synaptosome-derived (E) and cerebellar glomerulus-derived (F) PSD preparations. Receptor abundances in IB2−/− PSDs are normal.

Altered transmission at IB2−/− cerebellar mossy fiber–granule cell synapses. A, Increased NMDA/AMPA ratio of EPSCs at mossy fiber–granule cell synapses in IB2−/− compared to wild-type mice. Mean EPSC traces for AMPA and NMDA receptor-mediated currents recorded at −70 mV/+60 mV in the presence of 1.2 mm Mg2+ (left) and at −70 mV in Mg2+-free extracellular solution (right). In the left panel, the two cells have been selected to have similar AMPA currents at −70 mV to facilitate comparison of the NMDA currents. The EPSCs at +60 mV are shown on reduced time scale to illustrate the NMDA currents. The black and gray lines indicate current traces from wild-type and IB2−/− mice. B, Increased EPSCNMDA and decreased EPSCAMPA at IB2−/− synapses. The amplitude of EPSCNMDA and EPSCAMPA for each recorded cell in wild-type (black) and IB2−/− (gray) mice are plotted for comparison. Open circles with brackets represent mean ± SD of synapses of each genotype. EPSCNMDA at IB2−/− synapses is on average more than double of that measured at wild-type synapses, while EPSCAMPA is reduced ∼30% in the mutant (also see supplemental Table 1, available at www.jneurosci.org as supplemental material). The oval encloses the wild-type cell and mutant cell depicted on left in A. C, Minimal EPSC recordings at −70 mV. The AMPA current, despite similar maximum amplitude, shows higher variation and more failures (indicated by persistence of indirect component) in IB2−/− (gray traces) than in wild-type (black traces) mice. Red traces are averages of the corresponding 50 individual responses, while the blue trace is the average of the indirect responses in IB2−/− only (no indirect responses are present in this particular wild-type recording). The inset shows an IB2−/− individual EPSC composite response (gray) or indirect response only (blue). Note that the indirect response is slower than the direct response (dashed lines indicate the time of peak). D, AMPA EPSCs undergo less paired-pulse depression in IB2−/− than in wild-type mice. The average of 100 EPSC traces recorded at −70 mV for paired stimuli with 30 ms interpulse interval is shown. E, AMPA EPSCs from all cells recorded at −70 mV are presented as scatter plots showing average EPSC peak amplitude, FR, CV, and paired-pulse ratio (PPR) for IB2−/− (gray) and wild-type (black) mice. The white circles represent mean ± SEM of the points reported in the plots. See accompanying data summaries in supplemental Table 2 (available at www.jneurosci.org as supplemental material).

Altered transmission at IB2−/− cerebellar climbing fiber–Purkinje cell synapses. Purkinje cells were whole-cell patched using pipettes filled with CsCl-based solution containing 2 mm QX-314. All-or-nothing EPSCs were recorded following climbing fiber stimulation while voltage clamping cells at +40 mV; under these conditions, AMPA/kainate-evoked currents were outward, NMDA currents (if any) were suppressed, and voltage-gated calcium currents were also suppressed by inactivation. A, Wild-type Purkinje cell climbing fiber-evoked EPSC has large amplitude and rapid onset and decay, and current is fully blocked by bath perfusion with NBQX. B, An IB2−/− Purkinje cell EPSC representative of 53% (9 of 17) recorded cells shows normal amplitude and kinetics. C, IB2−/− Purkinje cell EPSC representative of 47% (8 of 17) recorded cells is anomalously small and delayed (note different current scale). D, In a plot of EPSC density versus time-to-peak for all recorded Purkinje cells, IB2−/− cells fall into either normal or anomalous response classes. See accompanying data summaries in supplemental Table 3 (available at www.jneurosci.org as supplemental material).

Altered Purkinje cell morphology and normal climbing fiber innervation in IB2−/− cerebella. A, a, B, b, Individual Purkinje cells in sagittal slices of cerebellar vermis were filled with biocytin–Oregon Green by diffusion from a whole-cell patch pipette. Serial stacks of 40× magnification confocal fluorescent images were used for three-dimensional reconstruction of the entire dendritic arbors (A, B), while 1000× magnification imaging was used to view dendritic spines (a, b). The IB2−/− cell's arbor is shorter in height (A), likely reflecting lesser intracellular dendritic volume (supplemental Table 4, available at www.jneurosci.org as supplemental material) and reduced overall thickness of the cerebellar molecular layer. The density of spines (a) on IB2−/− dendrites is normal (and supplemental Table 4, available at www.jneurosci.org as supplemental material). C–F, Detection of cerebellar climbing fiber varicosities. Cryosections were immunostained for climbing fiber-specific glutamate vesicular transporter VGluT2 (green) and Purkinje cell marker calbindin (red), and costained with nuclear marker TOPRO iodide (blue pseudocolor). In confocal fluorescent image stacks at 63× magnification, wild-type (C) and IB2−/− (D) climbing fiber varicosities are seen to project along Purkinje arbors extending through much of, but not the entire, molecular layer, and imaging at higher magnification shows examples of varicosities decorating wild-type (E) and mutant (F) dendrites.
References
-
- Bauman ML, Kemper TL. Neuroanatomic observations of the brain in autism: a review and future directions. Int J Dev Neurosci. 2005;23:183–187. - PubMed
-
- Bobée S, Mariette E, Tremblay-Leveau H, Caston J. Effects of early midline cerebellar lesion on cognitive and emotional functions in the rat. Behav Brain Res. 2000;112:107–117. - PubMed
Publication types
MeSH terms
Substances
Grants and funding
LinkOut - more resources
Full Text Sources
Other Literature Sources
Medical
Molecular Biology Databases