. 2010 Nov 3;30(44):14870-82.
doi: 10.1523/JNEUROSCI.2428-10.2010.

Chronic spontaneous activity generated in the somata of primary nociceptors is associated with pain-related behavior after spinal cord injury

Affiliations

Chronic spontaneous activity generated in the somata of primary nociceptors is associated with pain-related behavior after spinal cord injury

Supinder S Bedi et al. J Neurosci. .

Abstract

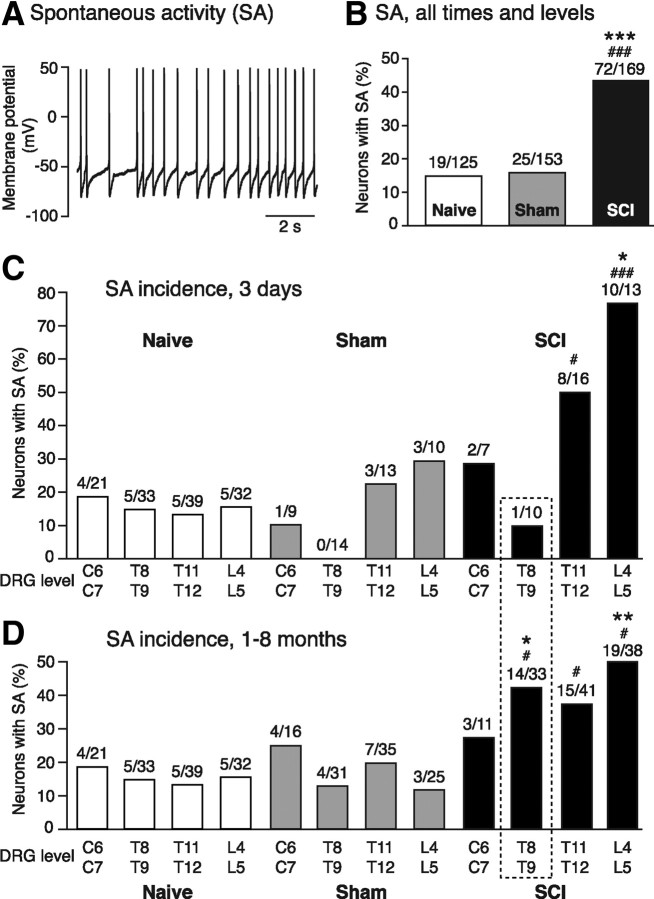
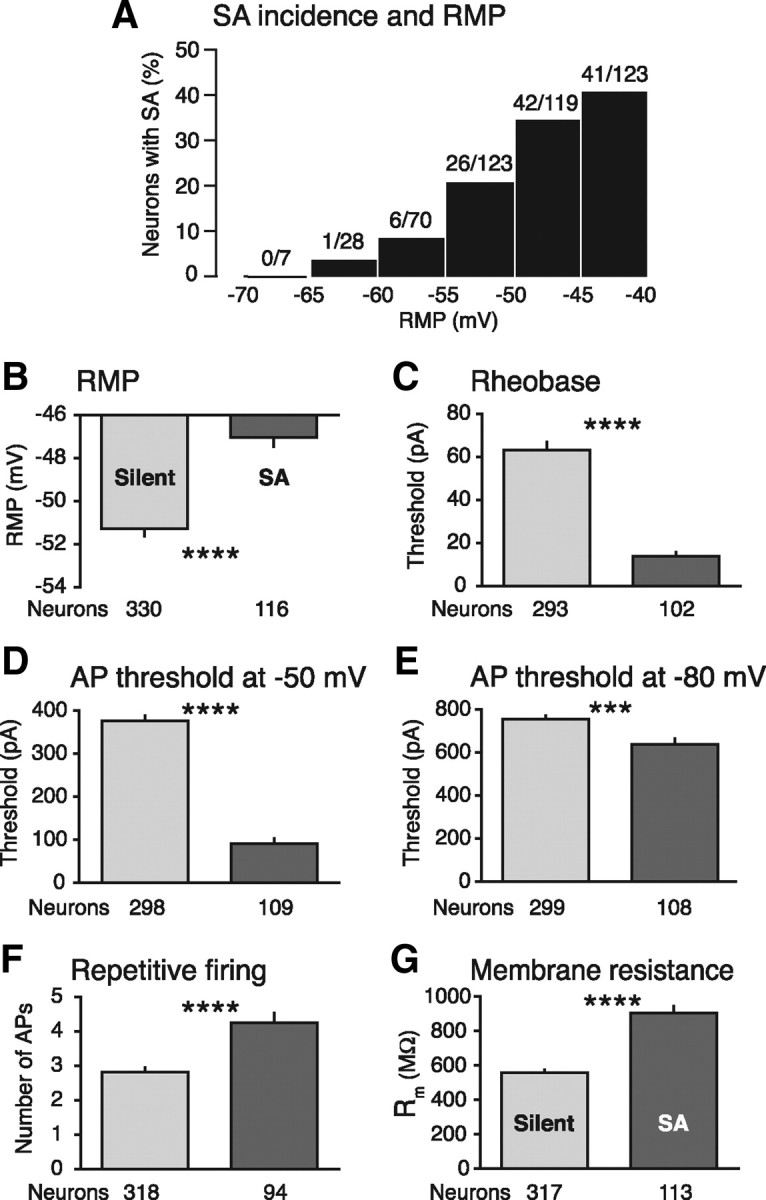
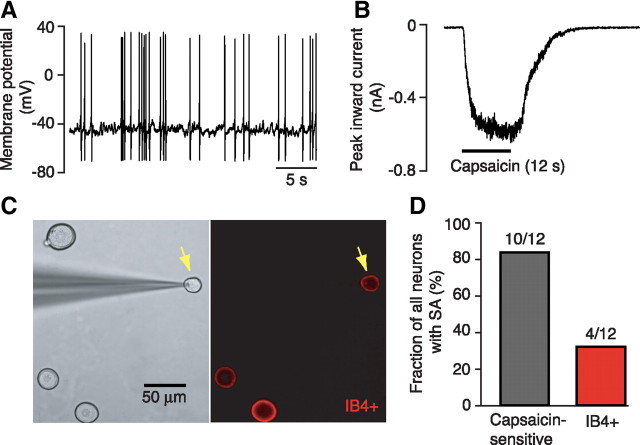
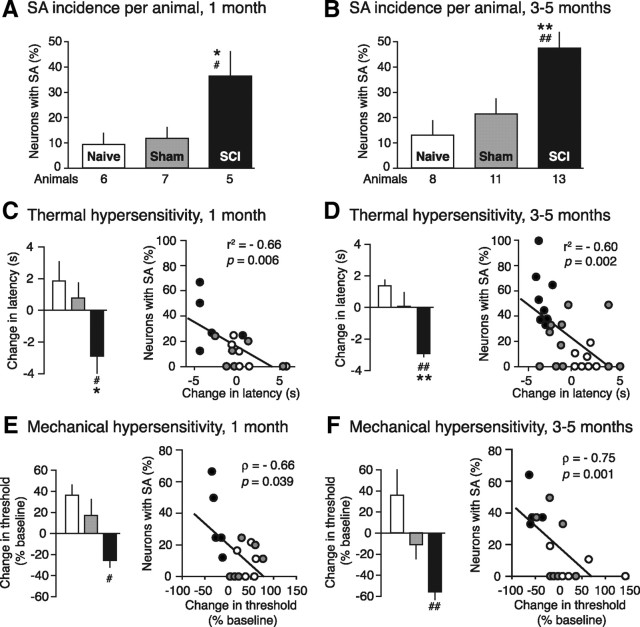
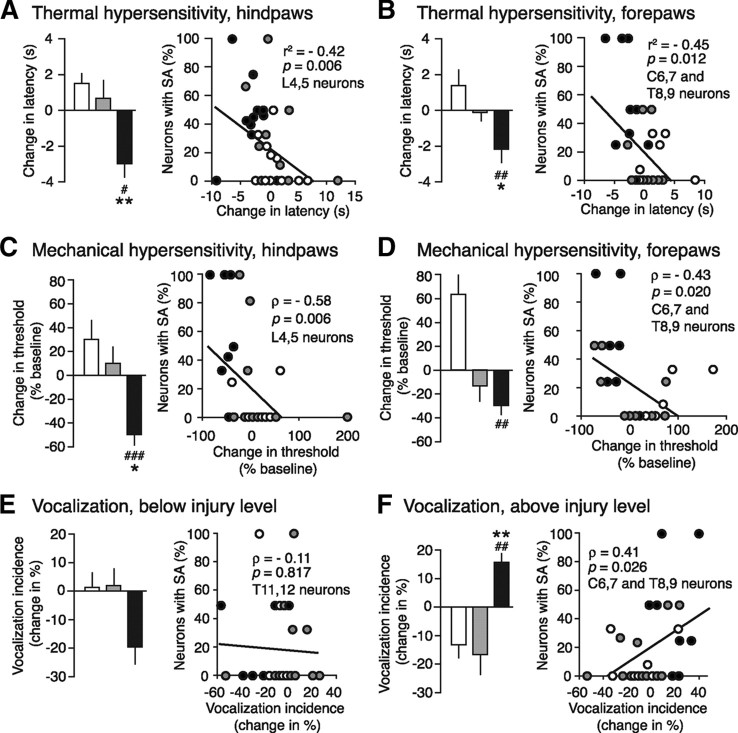
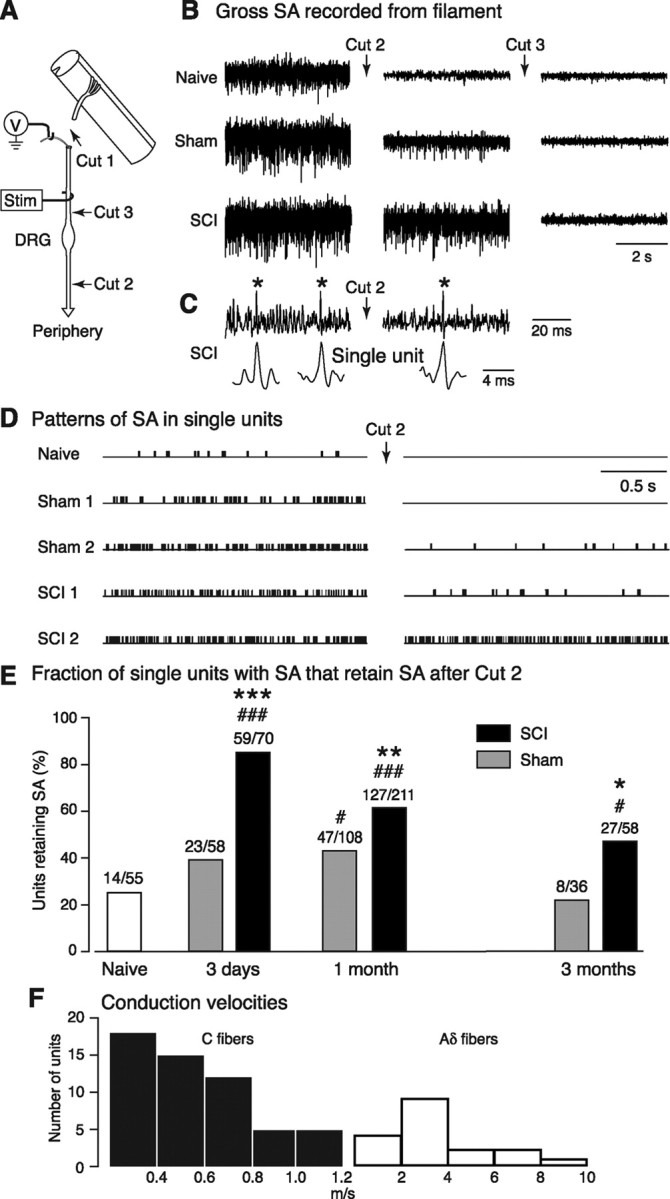
Mechanisms underlying chronic pain that develops after spinal cord injury (SCI) are incompletely understood. Most research on SCI pain mechanisms has focused on neuronal alterations within pain pathways at spinal and supraspinal levels associated with inflammation and glial activation. These events might also impact central processes of primary sensory neurons, triggering in nociceptors a hyperexcitable state and spontaneous activity (SA) that drive behavioral hypersensitivity and pain. SCI can sensitize peripheral fibers of nociceptors and promote peripheral SA, but whether these effects are driven by extrinsic alterations in surrounding tissue or are intrinsic to the nociceptor, and whether similar SA occurs in nociceptors in vivo are unknown. We show that small DRG neurons from rats (Rattus norvegicus) receiving thoracic spinal injury 3 d to 8 months earlier and recorded 1 d after dissociation exhibit an elevated incidence of SA coupled with soma hyperexcitability compared with untreated and sham-treated groups. SA incidence was greatest in lumbar DRG neurons (57%) and least in cervical neurons (28%), and failed to decline over 8 months. Many sampled SA neurons were capsaicin sensitive and/or bound the nociceptive marker, isolectin B4. This intrinsic SA state was correlated with increased behavioral responsiveness to mechanical and thermal stimulation of sites below and above the injury level. Recordings from C- and Aδ-fibers revealed SCI-induced SA generated in or near the somata of the neurons in vivo. SCI promotes the entry of primary nociceptors into a chronic hyperexcitable-SA state that may provide a useful therapeutic target in some forms of persistent pain.


Figures

Figure 1.
Figure 1.
SCI increases the incidence of SA in small DRG neurons recorded 1 d after dissociation. A, Example of SA (∼2 Hz) in a DRG neuron dissociated from an L4 DRG 3 d after SCI. B, Incidence of SA in small DRG neurons dissociated from all sampled levels (C6, C7, T8, T9, T11, T12, L4, L5) and times after injury (3 d to 8 months). Ratios over each bar indicate the number of neurons exhibiting SA over the total number of neurons sampled in each group. The incidence of SA in the SCI group was significantly greater than that in the naive and sham groups. C, D, Incidence of SA in dissociated DRG neurons at each sampled level 3 d after injury and 1–8 months after injury. Within the naive group, no statistically significant differences were found overall or at any level between neurons tested 3 d and 1–8 months after injury of the corresponding SCI and sham groups, so the naive data from these different test periods were combined to increase statistical power. The incidence of SA was significantly greater in L4/L5 neurons in the SCI group (black) than in the naive (white) and sham (gray) groups 3 d and 1–8 months after injury, whereas in T8/T9 neurons SA was significantly elevated 1–8 months after SCI but not 3 d after SCI (dashed box). In this and subsequent figures, statistical significance is indicated as follows: SCI versus sham, *p < 0.05, **p < 0.01, ***p < 0.001; SCI versus naive, #p < 0.05, ##p < 0.01, ###p < 0.001.
Figure 2.
Figure 2.
Electrophysiological differences between SA neurons and silent neurons near RMP and at hyperpolarized holding potentials. A, Fractions of sampled neurons exhibiting SA in different ranges of RMP. B, Reduction of RMP in SA neurons. C, Reduction of rheobase in SA neurons. Rheobase threshold was tested with 400 ms pulses delivered at a holding potential of −50 mV. D, Reduction of AP threshold tested with 2 ms pulses at −50 mV in SA neurons. E, Reduction of AP threshold tested with 2 ms pulses at −80 mV in SA neurons. F, Increase in repetitive firing tested with 400 ms pulses at −50 mV. G, Increase in Rm tested under voltage clamp at −60 mV. ***p < 0.001; ****p < 0.0001. Error bars indicate SEM.
Figure 3.
Figure 3.
Dissociated small DRG neurons exhibit two markers for nociceptors. A, SA under current clamp in a neuron examined 3 months after SCI. B, Response of the same neuron to 3 μm capsaicin. C, Sampled neuron showing micropipette (left) and binding by fluorescent IB4 (right). Two other neurons were IB4+, but the fourth (largest) neuron was not. D, Fractions of all neurons from SCI animals that exhibited SA and either responses to capsaicin or binding of isolectin B4 (IB4+).
Figure 4.
Figure 4.
Increased SA incidence after SCI is correlated with behavioral alterations. A, B, Significant enhancement of SA incidence in small DRG neurons after SCI compared with the naive and sham groups when sampled 1 and 3–5 months after injury and expressed as mean SA incidence per animal. C, D, Thermal hypersensitivity (reduction in latency for paw withdrawal) produced by SCI is correlated significantly with increased SA 1 and 3–5 months after injury. The bar graphs here and in the rest of this figure plot the mean response scores averaged across all four limbs from the same animals as indicated in A and B. E, F, Significant mechanical hypersensitivity (reduction in threshold for paw withdrawal) produced by SCI is correlated significantly with increased SA 1 and 3–5 months after injury. White fill, Naive; gray fill, sham; black fill, SCI. Error bars indicate SEM.
Figure 5.
Figure 5.
Altered behavioral responses are correlated with increased incidence of SA below and above the injury level. A, B, Similarities in thermal hypersensitivity and correlations with increased SA observed below (hindpaws) and above (forepaws) the injury level. These and other data in this figure were combined from the animals tested behaviorally 1 and 3–5 months after injury (same animals as in Fig. 4). Hindpaw responses were correlated with SA in dissociated neurons taken from L4 and L5 DRGs. Forepaw responses were correlated with SA in neurons taken from C6, C7, T8, and T9 DRGs (see text). C, D, Similarities in mechanical hypersensitivity and correlations with increased SA observed below (hindpaws) and above (forepaws) the injury level. Hindpaw responses were correlated with SA in neurons taken from L4 and L5 DRGs. Forepaw responses were correlated with SA in neurons taken from C6, C7, T8, and T9 DRGs. E, F, Effects of SCI on vocalization responses differ above and below the injury level. No significant change in vocalization evoked by mechanical stimulation of the dorsal girdle region occurred below the injury level. Above the injury level, the evoked vocalizations increased significantly and were correlated with increased activity in neurons taken from C6, C7, T8, and T9 DRGs. White fill, Naive; gray fill, sham; black fill, SCI. Error bars indicate SEM.
Figure 6.
Figure 6.
Increased incidence of SA occurs in vivo after SCI and is generated in or near the DRG. A, Schematic showing the in vivo site for recording dorsal root filaments and sites of transection used to demonstrate activity generated in or near the DRG. B, Examples of gross activity recorded extracellularly from dorsal root filaments. C, Example of an action potential identified with a single unit before and after cut 2 in an SCI animal. D, Examples of patterns of single-unit activity before and after cut 2. The naive and sham 1 examples showed complete abolition of SA by cut 2. Sham 2 and SCI 1 showed a reduction in frequency after cut 2 (to ∼3 and ∼4 Hz, respectively). SCI 2 showed no change after cut 2 (remaining at ∼30 Hz). E, Increased incidence of single-unit SA after cut 2 (generated in or near the DRG) after SCI at different times after injury. Indicated p values compare the incidence of remaining SA in the SCI group to SA in the corresponding sham group at the same time point and to SA in the single naive group. F, Distribution of conduction velocities randomly selected for measurement in a subset of the tested units.

Similar articles

Cited by

References

    1. Abram SE, Yi J, Fuchs A, Hogan QH. Permeability of injured and intact peripheral nerves and dorsal root ganglia. Anesthesiology. 2006;105:146–153. - PubMed
    1. Ali Z, Ringkamp M, Hartke TV, Chien HF, Flavahan NA, Campbell JN, Meyer RA. Uninjured C-fiber nociceptors develop spontaneous activity and alpha-adrenergic sensitivity following L6 spinal nerve ligation in monkey. J Neurophysiol. 1999;81:455–466. - PubMed
    1. Amir R, Devor M. Ongoing activity in neuroma afferents bearing retrograde sprouts. Brain Res. 1993;630:283–288. - PubMed
    1. Andersen OK, Finnerup NB, Spaich EG, Jensen TS, Arendt-Nielsen L. Expansion of nociceptive withdrawal reflex receptive fields in spinal cord injured humans. Clin Neurophysiol. 2004;115:2798–2810. - PubMed
    1. Basso DM, Beattie MS, Bresnahan JC. A sensitive and reliable locomotor rating scale for open field testing in rats. J Neurotrauma. 1995;12:1–21. - PubMed

Publication types

MeSH terms