. 2011 Jan 27;117(4):1239-49.
doi: 10.1182/blood-2010-07-299263. Epub 2010 Nov 3.

Recent thymic emigrants are biased against the T-helper type 1 and toward the T-helper type 2 effector lineage

Affiliations

Recent thymic emigrants are biased against the T-helper type 1 and toward the T-helper type 2 effector lineage

Deborah W Hendricks et al. Blood. .

Abstract

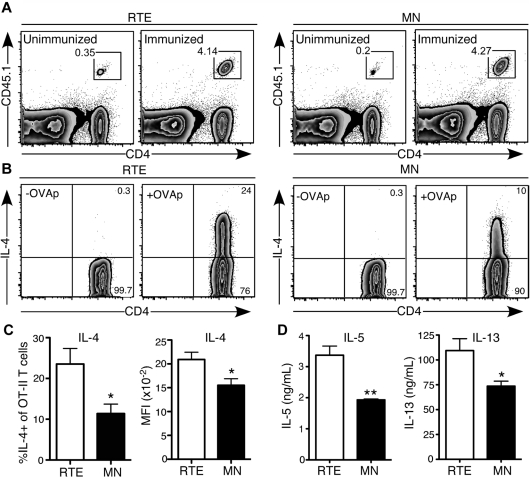
After intrathymic development, T cells exit the thymus and join the peripheral T-cell pool. Such recent thymic emigrants (RTEs) undergo both phenotypic and functional maturation during the first 3 weeks they reside in the periphery. Using a well-controlled in vitro polarization scheme, we now show that CD4(+) RTEs are defective in T-helper (Th) type 0 (Th0), Th1, Th17, and regulatory T-cell lineage commitment, with dampened cytokine production and transcription factor expression. In contrast, CD4(+) RTES are biased toward the Th2 lineage both in vitro and in vivo, with more robust interleukin-4, interleukin-5, and interleukin-13 production than their mature naive counterparts. Coculture experiments demonstrate that mature naive T cells influence neighboring RTEs in their Th responses. In adoptive hosts, CD4(+) RTEs drive production of the Th2-associated antibody isotype immunoglobulin G1 and mediate airway inflammatory disease. This bias in RTEs likely results from dampened negative regulation of the Th2 lineage by diminished levels of T-bet, a key Th1 transcription factor. CD4(+) RTEs thus represent a transitional population with a distinct interpretation of, and response to, immunologic cues. These characteristics may be beneficial during the postthymic maturation period by leading to the avoidance of inappropriate immune responses, particularly in lymphopenic neonates and adults.


Figures

Figure 1
Figure 1
CD4+ RTEs exhibit striking functional defects under Th0 conditions in vitro. CFSE-labeled CD4+ RTEs and MN T cells were stimulated under Th0 conditions for (A) 24 and 48 hours and (B-C) 3 days, stained for intracellular cytokines, and gated as CD4+. (A) Representative data for cells pooled from 3 mice. Numbers in the top right of the gate represent percentage of total IL-2+ cells, whereas numbers in the top left (for the 48-hour plots) represent the percentage of IL-2 producers among those cells that had divided at least once. MFI indicates mean fluorescence intensity. (B) Left panels are representative data; the numbers in quadrants represent the percentage of cytokine-positive cells. In right panels, compiled data are presented as mean ± SEM for 5 independent experiments with cells pooled from 3-4 mice per experiment and a range of anti-CD3 concentrations from 30-500 ng/mL. (C) Histograms (left panel) represent CFSE dilution by RTEs (shaded) and MN T cells (open), and numbers denote the percentage of cells that had undergone ≥ 3 divisions. Numbers in right panels represent the percentage of cytokine producers among those cells that had undergone ≥ 3 divisions. Data are representative of 2 independent experiments with cells pooled from 3-4 mice per experiment and 30 ng/mL anti-CD3. Probability values were calculated with either a paired or unpaired 2-tailed Student t test: *P < .05, **P < .005.
Figure 2
Figure 2
CD4+ RTEs are defective in Th1 lineage commitment in vitro. CFSE-labeled CD4+ RTEs and MN T cells were differentiated under Th1 conditions for (A) 5 days and (B) 3 days, stained for intracellular IFN-γ and IL-17, and gated as CD4+. (A) Left panels are representative flow cytometry plots. Numbers in quadrants represent the percentage of cells that were cytokine positive. MFI values are for IFN-γ+ populations and are significantly different (P < .05). In the right panel, compiled data are presented as mean ± SEM for 5 independent experiments with cells pooled from 3-4 mice per experiment and a range of anti-CD3 concentrations from 30-500 ng/mL. *Significant difference (P < .05) between populations. (B) Numbers in left panels represent the percentage of cytokine producers among cells that had undergone ≥ 3 divisions. Histograms in right panel represent CFSE dilution by RTEs (shaded) and MN T cells (open), and numbers denote the percentage of cells that had undergone ≥ 3 divisions. Graph represents the percentage of cytokine-producing cells in each division (undiv indicates undivided). Data are representative of 2 independent experiments with cells pooled from 3-4 mice per experiment and 30 ng/mL anti-CD3.
Figure 3
Figure 3
CD4+ RTEs are defective in their commitment to the iTreg and Th17 lineages. (A) CD4+ RTEs and MN T cells were differentiated under iTreg conditions for 3 days and then stained for intracellular Foxp3. Left panels are representative plots, and right panel shows compiled data presented as mean ± SEM for 3 independent experiments with cells pooled from 2-3 mice per experiment. CFSE-labeled CD4+ RTEs and MN T cells were differentiated under Th17 conditions for (B) 5 days or (C) 3 days, stained for intracellular IL-17A and IFN-γ, and gated as CD4+. (B) Left panels are representative flow cytometry plots. Numbers in quadrants represent the percentage of cells that were cytokine-positive. MFI values are for IL-17A+ populations and are significantly different (*P < .05). In the right panel, compiled data are presented as mean ± SEM for 5 independent experiments with cells pooled from 3-4 mice per experiment and a range of anti-CD3 concentrations from 30-500 ng/mL. **Significant differences between populations (P < .005). (C) Numbers in left panels represent the percentage of cytokine producers among cells that had undergone ≥ 3 divisions. Histograms in right panel represent CFSE dilution by RTEs (shaded) and MN T cells (open), and numbers denote the percentage of cells that had undergone ≥ 3 divisions. Data are representative of 2 independent experiments with cells pooled from 3-4 mice per experiment and 30 ng/mL anti-CD3.
Figure 4
Figure 4
CD4+ RTEs are biased toward the Th2 effector lineage in vitro. (A) CD4+ RTEs and MN T cells were differentiated under Th2 conditions for 5 days and then stained for IL-4. Numbers in quadrants of representative flow cytometry plots show the percentage of IL-4+ cells. In the right panel, compiled data are presented as mean ± SEM for 8 independent experiments with cells pooled from 3-4 mice per experiment and a range of anti-CD3 concentrations from 30-500 ng/mL. ***Significant difference between populations (P < .0005). (B-D) Supernatants from Th0- and Th2-differentiated CD4+ RTEs and MN T cells were assayed by ELISA for (B) IL-4, (C) IL-5, and (D) IL-13. Error bars represent SD for triplicate wells. Data are representative of ≥ 2 independent experiments with cells pooled from 2-4 mice per experiment. **P < .005, ***P < .0005. (E) CFSE-labeled CD4+ RTEs and MN T cells were differentiated under Th2 conditions for 3 days and stained for IL-4. Numbers represent the percentage of IL-4 producers among cells that had undergone ≥ 4 divisions. Histograms represent CFSE dilution by RTEs (shaded) and MN T cells (open), and numbers denote the percentage of cells that had undergone ≥ 4 divisions. (F) Graph represents the percentage of IL-4–producing cells in each division (undiv indicates undivided). Data are representative of 2 independent experiments with cells pooled from 3-4 mice per experiment and 30 ng/mL anti-CD3. (G) Purified CD4+ RTEs and MN T cells were stimulated directly ex vivo for 5 hours with or without PMA and ionomycin (P/I). Cells were stained for intracellular IL-4 and IFN-γ and gated as CD4+CD44lo. Numbers in quadrants represent the percentages of cytokine-positive cells.
Figure 5
Figure 5
CD4+ RTEs are characterized by distinct transcription factor and cytokine-receptor expression patterns. (A) CD4+ RTEs and MN T cells were differentiated under Th0 or Th1 conditions for 5 days and then stained for intracellular T-bet. Representative histograms show Th0 and Th1 CD4+ RTEs (shaded) or MN T cells (open) and MN T cells stained directly ex vivo (dashed line). MFI values were normalized by expressing RTE values as a percentage of the MN value, which was set to 1, and these compiled data are presented as mean ± SEM for 4 independent experiments with cells pooled from 3-4 mice per experiment and anti-CD3 concentrations ranging from 30-500 ng/mL. *P < .05, **P < .005. qRT-PCR for (B) Tbx21, (C) Il12rb1, and (D) Cxcr3 expression on ex vivo and Th0- or Th1-differentiated CD4+ RTEs and MN T cells. Data are presented as mean ± SD for 3 independent experiments with cells pooled from 2-4 mice per experiment for each target. *P < .05, **P < .005, ***P < .0005. (E) CD4+ RTEs and MN T cells were stained for IL-4Rα directly ex vivo or 5 days after stimulation under Th0 and Th2 conditions. Representative histograms show RTEs (shaded), MN T cells (solid line), and isotype control (dotted line). MFI of IL-4Rα for Th0 RTEs was 220 ± 77, and for Th0 MN T cells, it was 532 ± 109, and this difference was significant (P = .005). MFI of IL-4Rα for Th2 RTEs was 863 ± 69, and for Th2 MN T cells, it was 948 ± 92, and this difference was not significant (n.s.; P > .05). MFI data were compiled from 3 independent experiments with cells pooled from 2-3 mice per experiment. (F) qRT-PCR for GATA3 expression on purified ex vivo and 5 day Th2-differentiated CD4+ RTEs and MN T cells. Data are presented as mean ± SD for 3 independent experiments with cells pooled from 2-3 mice per experiment. *P < .05.
Figure 6
Figure 6
CD4+ RTEs are biased to Th2 effector responses in vivo. Purified OT-II TCR Tg CD4+CD45.1+ RTEs and MN T cells were transferred into B6 hosts and immunized subcutaneously 1 day later with OVA and papain. Cells from draining inguinal LNs were analyzed for cytokine production on day 4. (A) Representative flow cytometry plots show accumulation of CD4+ RTEs (left) and MN T cells (right) in unimmunized and immunized hosts. Gated cells are > 99% Vα2+Vβ5+. (B) Representative plot showing IL-4 production by transferred Vα2+Vβ5+ OT-II RTE (left) and MN (right) T cells after a 5-hour restimulation in the presence (+OVAp) or absence (-OVAp) of OVA323-339 peptide. Numbers represent percentage of cells in that gate. (C) Percentage of IL-4+ OT-II CD4+ T cells and MFI of IL-4+ cells. Compiled data are presented as mean ± SEM for 4 individually analyzed mice per group. *P < .05. (D) Transferred OT-II CD4+ RTEs and MN T cells were sort purified and restimulated with plate-bound anti-CD3 plus anti-CD28. Supernatants were harvested after 72 hours and assayed for IL-5 and IL-13 by ELISA. Data are presented as mean ± SD of triplicate wells. *P < .05, **P < .005.
Figure 7
Figure 7
CD4+ RTEs mediate enhanced Th2 pathology in an acute model of airway inflammation. Purified OT-II TCR Tg CD4+CD45.1+ RTEs and MN T cells were transferred into B6 hosts on day 0. Hosts were treated intranasally with TSLP and OVA every other day for 14 days. Analysis was performed on day 15. (A) Representative flow cytometry plots show IL-4 and IFN-γ production by transferred Vα2+Vβ5+ OT-II RTE and MN T cells isolated by BAL after a 5-hour restimulation in vitro in the presence of OVA323-339 peptide. Numbers represent percentage of cytokine-positive cells in that gate. (B) Graphs show percentage of IL-4+ (left panel) and IFN-γ+ (right panel) of transferred OT-II RTEs and MN T cells. Each symbol represents 1 individually analyzed mouse. (C) Total number of cells (left) and number of transferred OT-II cells (right) isolated by BAL of immunized hosts that received either CD4+ RTEs or MN T cells. Each symbol represents 1 individually analyzed mouse. (D) Differential cells counts from cytospins of BAL fluid. Data are mean ± SD for 2 independent experiments with 6-7 individually analyzed mice per group. *P < .05, **P < .005.

References

    1. Berzins SP, Uldrich AP, Sutherland JS, et al. Thymic regeneration: teaching an old immune system new tricks. Trends Mol Med. 2002;8(10):469–476. - PubMed
    1. Hale JS, Boursalian TE, Turk GL, Fink PJ. Thymic output in aged mice. Proc Natl Acad Sci U S A. 2006;103(22):8447–8452. - PMC - PubMed
    1. Opiela SJ, Koru-Sengul T, Adkins B. Murine neonatal recent thymic emigrants (RTE) are phenotypically and functionally distinct from adult RTE. Blood. 2009;113(22):5635–5643. - PMC - PubMed
    1. Yager EJ, Ahmed M, Lanzer K, Randall TD, Woodland DL, Blackman MA. Age-associated decline in T cell repertoire diversity leads to holes in the repertoire and impaired immunity to influenza virus. J Exp Med. 2008;205(3):711–723. - PMC - PubMed
    1. Starr TK, Jameson SC, Hogquist KA. Positive and negative selection of T cells. Annu Rev Immunol. 2003;21:139–176. - PubMed

Publication types

MeSH terms