

Highly reproducible label free quantitative proteomic analysis of RNA polymerase complexes
- PMID: 21048197
- PMCID: PMC3033667
- DOI: 10.1074/mcp.M110.000687
Highly reproducible label free quantitative proteomic analysis of RNA polymerase complexes
Abstract
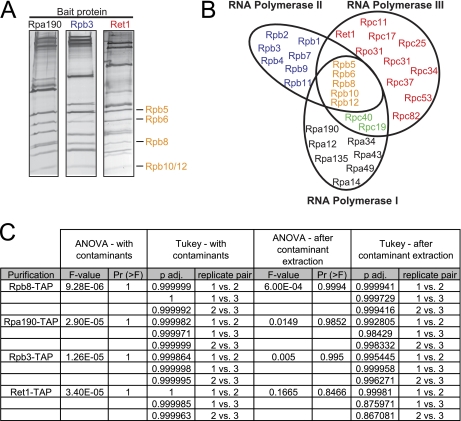
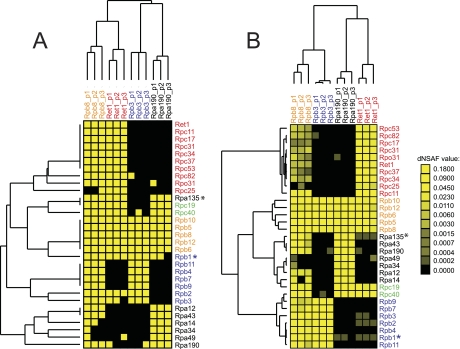
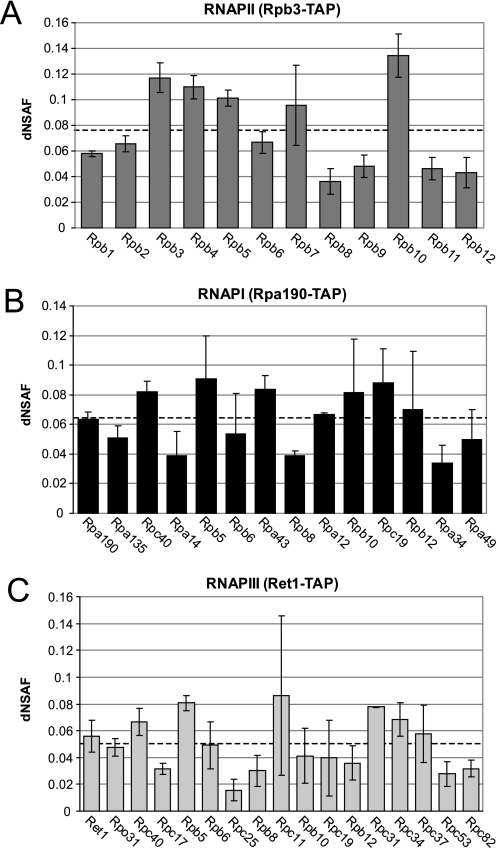
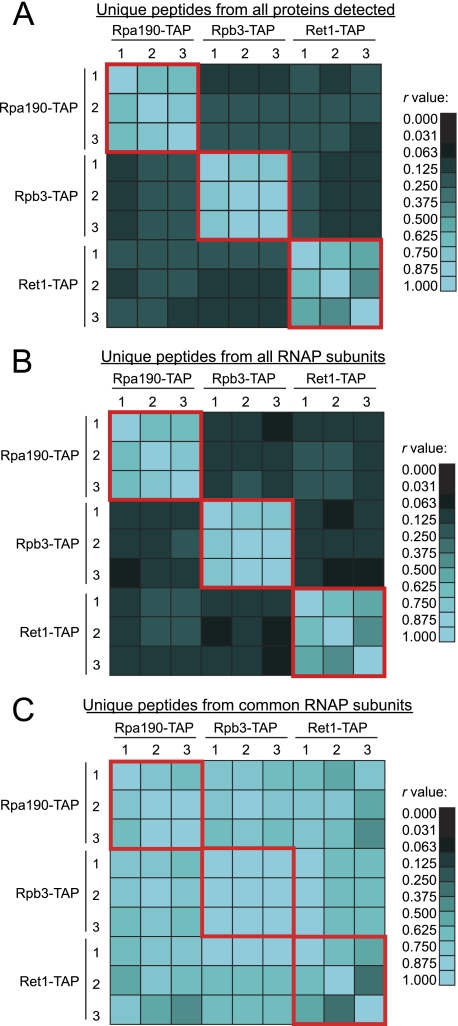
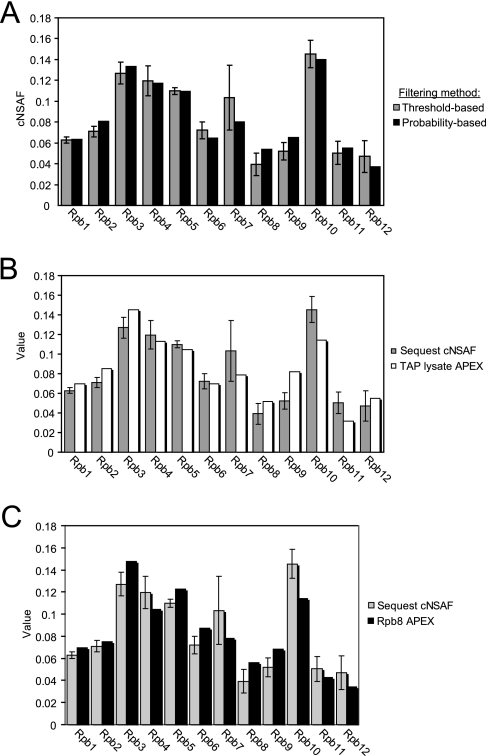
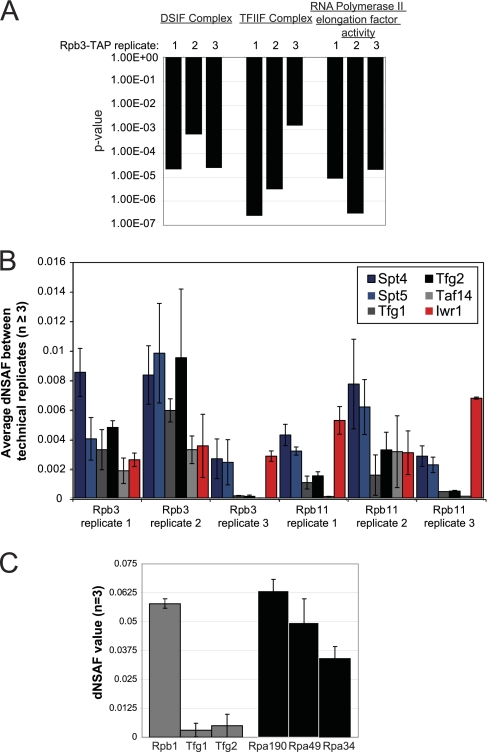
The use of quantitative proteomics methods to study protein complexes has the potential to provide in-depth information on the abundance of different protein components as well as their modification state in various cellular conditions. To interrogate protein complex quantitation using shotgun proteomic methods, we have focused on the analysis of protein complexes using label-free multidimensional protein identification technology and studied the reproducibility of biological replicates. For these studies, we focused on three highly related and essential multi-protein enzymes, RNA polymerase I, II, and III from Saccharomyces cerevisiae. We found that label-free quantitation using spectral counting is highly reproducible at the protein and peptide level when analyzing RNA polymerase I, II, and III. In addition, we show that peptide sampling does not follow a random sampling model, and we show the need for advanced computational models to predict peptide detection probabilities. In order to address these issues, we used the APEX protocol to model the expected peptide detectability based on whole cell lysate acquired using the same multidimensional protein identification technology analysis used for the protein complexes. Neither method was able to predict the peptide sampling levels that we observed using replicate multidimensional protein identification technology analyses. In addition to the analysis of the RNA polymerase complexes, our analysis provides quantitative information about several RNAP associated proteins including the RNAPII elongation factor complexes DSIF and TFIIF. Our data shows that DSIF and TFIIF are the most highly enriched RNAP accessory factors in Rpb3-TAP purifications and demonstrate our ability to measure low level associated protein abundance across biological replicates. In addition, our quantitative data supports a model in which DSIF and TFIIF interact with RNAPII in a dynamic fashion in agreement with previously published reports.
Figures

Similar articles
-
Reproducibility of quantitative proteomic analyses of complex biological mixtures by multidimensional protein identification technology.Anal Chem. 2003 Oct 1;75(19):5054-61. doi: 10.1021/ac034120b. Anal Chem. 2003. PMID: 14708778
-
Examining the complexity of human RNA polymerase complexes using HaloTag technology coupled to label free quantitative proteomics.J Proteome Res. 2012 Feb 3;11(2):564-75. doi: 10.1021/pr200459c. Epub 2012 Jan 3. J Proteome Res. 2012. PMID: 22149079
-
A multi-model statistical approach for proteomic spectral count quantitation.J Proteomics. 2016 Jul 20;144:23-32. doi: 10.1016/j.jprot.2016.05.032. Epub 2016 May 31. J Proteomics. 2016. PMID: 27260494 Free PMC article.
-
Methods review: Mass spectrometry analysis of RNAPII complexes.Methods. 2019 Apr 15;159-160:105-114. doi: 10.1016/j.ymeth.2019.03.013. Epub 2019 Mar 19. Methods. 2019. PMID: 30902665 Free PMC article. Review.
-
Proteomic analysis of Saccharomyces cerevisiae.Expert Rev Proteomics. 2007 Dec;4(6):793-813. doi: 10.1586/14789450.4.6.793. Expert Rev Proteomics. 2007. PMID: 18067417 Review.
Cited by
-
Isolation and proteomic characterization of tropomyosin extracted from edible insect protein.Food Chem (Oxf). 2021 Nov 9;3:100049. doi: 10.1016/j.fochms.2021.100049. eCollection 2021 Dec 30. Food Chem (Oxf). 2021. PMID: 35415661 Free PMC article.
-
Spinophilin regulates phosphorylation and interactions of the GluN2B subunit of the N-methyl-d-aspartate receptor.J Neurochem. 2019 Oct;151(2):185-203. doi: 10.1111/jnc.14831. Epub 2019 Aug 2. J Neurochem. 2019. PMID: 31325175 Free PMC article.
-
Ubiquitination and degradation of SUMO1 by small-molecule degraders extends survival of mice with patient-derived tumors.Sci Transl Med. 2021 Oct 13;13(615):eabh1486. doi: 10.1126/scitranslmed.abh1486. Epub 2021 Oct 13. Sci Transl Med. 2021. PMID: 34644148 Free PMC article.
-
The acute transcriptomic and proteomic response of HC-04 hepatoma cells to hepatocyte growth factor and its implications for Plasmodium falciparum sporozoite invasion.Mol Cell Proteomics. 2014 May;13(5):1153-64. doi: 10.1074/mcp.M113.035584. Epub 2014 Feb 16. Mol Cell Proteomics. 2014. PMID: 24532842 Free PMC article.
-
Quantitative Analysis of Dynamic Protein Interactions during Transcription Reveals a Role for Casein Kinase II in Polymerase-associated Factor (PAF) Complex Phosphorylation and Regulation of Histone H2B Monoubiquitylation.J Biol Chem. 2016 Jun 24;291(26):13410-20. doi: 10.1074/jbc.M116.727735. Epub 2016 May 3. J Biol Chem. 2016. PMID: 27143358 Free PMC article.
References
-
- Krogan N. J., Cagney G., Yu H., Zhong G., Guo X., Ignatchenko A., Li J., Pu S., Datta N., Tikuisis A. P., Punna T., Peregrin-Alvarez J. M., Shales M., Zhang X., Davey M., Robinson M. D., Paccanaro A., Bray J. E., Sheung A., Beattie B., Richards D. P., Canadien V., Lalev A., Mena F., Wong P., Starostine A., Canete M. M., Vlasblom J., Wu S., Orsi C., Collins S. R., Chandran S., Haw R., Rilstone J. J., Gandi K., Thompson N. J., Musso G., St Onge P., Ghanny S., Lam M. H., Butland G., Altaf-Ul A. M., Kanaya S., Shilatifard A., O'Shea E., Weissman J. S., Ingles C. J., Hughes T. R., Parkinson J., Gerstein M., Wodak S. J., Emili A., Greenblatt J. F. (2006) Global landscape of protein complexes in the yeast Saccharomyces cerevisiae. Nature 440, 637–643 - PubMed
-
- Gavin A. C., Bösche M., Krause R., Grandi P., Marzioch M., Bauer A., Schultz J., Rick J. M., Michon A. M., Cruciat C. M., Remor M., Höfert C., Schelder M., Brajenovic M., Ruffner H., Merino A., Klein K., Hudak M., Dickson D., Rudi T., Gnau V., Bauch A., Bastuck S., Huhse B., Leutwein C., Heurtier M. A., Copley R. R., Edelmann A., Querfurth E., Rybin V., Drewes G., Raida M., Bouwmeester T., Bork P., Seraphin B., Kuster B., Neubauer G., Superti-Furga G. (2002) Functional organization of the yeast proteome by systematic analysis of protein complexes. Nature 415, 141–147 - PubMed
-
- Collins S. R., Kemmeren P., Zhao X. C., Greenblatt J. F., Spencer F., Holstege F. C., Weissman J. S., Krogan N. J. (2007) Toward a comprehensive atlas of the physical interactome of Saccharomyces cerevisiae. Mol. Cell Proteomics 6, 439–450 - PubMed
-
- Cramer P., Armache K. J., Baumli S., Benkert S., Brueckner F., Buchen C., Damsma G. E., Dengl S., Geiger S. R., Jasiak A. J., Jawhari A., Jennebach S., Kamenski T., Kettenberger H., Kuhn C. D., Lehmann E., Leike K., Sydow J. F., Vannini A. (2008) Structure of eukaryotic RNA polymerases. Annu. Rev. Biophys. 37, 337–352 - PubMed
-
- Gnatt A. L., Cramer P., Fu J., Bushnell D. A., Kornberg R. D. (2001) Structural basis of transcription: an RNA polymerase II elongation complex at 3.3 A resolution. Science 292, 1876–1882 - PubMed
Publication types
MeSH terms
Substances
Grants and funding
LinkOut - more resources
Full Text Sources
Molecular Biology Databases
Miscellaneous
