

GM-CSF-induced, bone-marrow-derived dendritic cells can expand natural Tregs and induce adaptive Tregs by different mechanisms
- PMID: 21048215
- PMCID: PMC3024903
- DOI: 10.1189/jlb.0310154
GM-CSF-induced, bone-marrow-derived dendritic cells can expand natural Tregs and induce adaptive Tregs by different mechanisms
Abstract
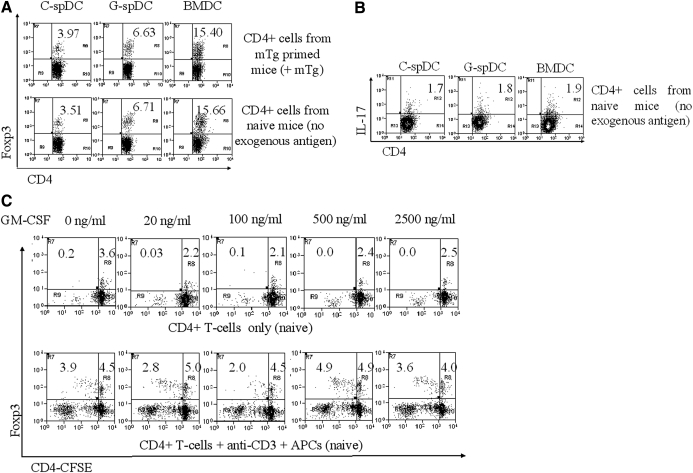
In our earlier work, we had shown that GM-CSF treatment of CBA/J mice can suppress ongoing thyroiditis by inducing tolerogenic CD8α(-) DCs, which helped expand and/or induce CD4(+)Foxp3(+) Tregs. To identify the primary cell type that was affected by the GM-CSF treatment and understand the mechanism by which Tregs were induced, we compared the effect of GM-CSF on matured spDCs and BMDC precursors in vitro. Matured spDCs exposed to GM-CSF ex vivo induced only a modest increase in the percentage of Foxp3-expressing T cells in cocultures. In contrast, BM cells, when cultured in the presence of GM-CSF, gave rise to a population of CD11c(+)CD11b(Hi)CD8α(-) DCs (BMDCs), which were able to expand Foxp3(+) Tregs upon coculture with CD4(+) T cells. This contact-dependent expansion occurred in the absence of TCR stimulation and was abrogated by OX40L blockage. Additionally, the BMDCs secreted high levels of TGF-β, which was required and sufficient for adaptive differentiation of T cells to Foxp3(+) Tregs, only upon TCR stimulation. These results strongly suggest that the BMDCs differentiated by GM-CSF can expand nTregs and induce adaptive Tregs through different mechanisms.
Figures


Similar articles
-
OX40L/Jagged1 cosignaling by GM-CSF-induced bone marrow-derived dendritic cells is required for the expansion of functional regulatory T cells.J Immunol. 2013 Jun 1;190(11):5516-25. doi: 10.4049/jimmunol.1202298. Epub 2013 Apr 29. J Immunol. 2013. PMID: 23630352 Free PMC article.
-
GM-CSF-induced CD11c+CD8a--dendritic cells facilitate Foxp3+ and IL-10+ regulatory T cell expansion resulting in suppression of autoimmune thyroiditis.Int Immunol. 2009 Mar;21(3):269-82. doi: 10.1093/intimm/dxn147. Epub 2009 Jan 27. Int Immunol. 2009. PMID: 19174473 Free PMC article.
-
Tolerogenic bone marrow-derived dendritic cells induce neuroprotective regulatory T cells in a model of Parkinson's disease.Mol Neurodegener. 2018 May 21;13(1):26. doi: 10.1186/s13024-018-0255-7. Mol Neurodegener. 2018. PMID: 29783988 Free PMC article.
-
IL-10-producing CD4+CD25+ regulatory T cells play a critical role in granulocyte-macrophage colony-stimulating factor-induced suppression of experimental autoimmune thyroiditis.J Immunol. 2005 Jun 1;174(11):7006-13. doi: 10.4049/jimmunol.174.11.7006. J Immunol. 2005. PMID: 15905543
-
Tolerogenic dendritic cells: all present and correct?Am J Transplant. 2010 Feb;10(2):214-9. doi: 10.1111/j.1600-6143.2009.02955.x. Epub 2010 Jan 5. Am J Transplant. 2010. PMID: 20055808 Free PMC article. Review.
Cited by
-
Near-infrared light-induced photothermal and immunotherapy system for lung cancer bone metastasis treatment with simultaneous bone repair.Bioact Mater. 2025 Jun 10;52:182-199. doi: 10.1016/j.bioactmat.2025.06.008. eCollection 2025 Oct. Bioact Mater. 2025. PMID: 40538765 Free PMC article.
-
A short protocol using dexamethasone and monophosphoryl lipid A generates tolerogenic dendritic cells that display a potent migratory capacity to lymphoid chemokines.J Transl Med. 2013 May 24;11:128. doi: 10.1186/1479-5876-11-128. J Transl Med. 2013. PMID: 23706017 Free PMC article.
-
Restoring self-tolerance in autoimmune diseases by enhancing regulatory T-cells.Cell Immunol. 2019 May;339:41-49. doi: 10.1016/j.cellimm.2018.09.008. Epub 2018 Sep 29. Cell Immunol. 2019. PMID: 30482489 Free PMC article. Review.
-
GM-CSF-neuroantigen fusion proteins reverse experimental autoimmune encephalomyelitis and mediate tolerogenic activity in adjuvant-primed environments: association with inflammation-dependent, inhibitory antigen presentation.J Immunol. 2014 Sep 1;193(5):2317-29. doi: 10.4049/jimmunol.1303223. Epub 2014 Jul 21. J Immunol. 2014. PMID: 25049359 Free PMC article.
-
GM-CSF: An immune modulatory cytokine that can suppress autoimmunity.Cytokine. 2015 Oct;75(2):261-71. doi: 10.1016/j.cyto.2015.05.030. Epub 2015 Jun 22. Cytokine. 2015. PMID: 26113402 Free PMC article. Review.
References
-
- Charreire J. (1989) Immune mechanisms in autoimmune thyroiditis. Adv. Immunol. 46, 263–334 - PubMed
-
- Weetman A. P., McGregor A. M. (1994) Autoimmune thyroid disease: further developments in our understanding. Endocr. Rev. 15, 788–830 - PubMed
-
- Sugihara S., Fujiwara H., Shearer G. M. (1993) Autoimmune thyroiditis induced in mice depleted of particular T cell subsets. Characterization of thyroiditis-inducing T cell lines and clones derived from thyroid lesions. J. Immunol. 150, 683–694 - PubMed
-
- Stafford E. A., Rose N. R. (2000) Newer insights into the pathogenesis of experimental autoimmune thyroiditis. Int. Rev. Immunol. 19, 501–533 - PubMed
-
- Vasu C., Dogan R. N., Holterman M. J., Prabhakar B. S. (2003) Selective induction of dendritic cells using granulocyte macrophage-colony stimulating factor, but not fms-like tyrosine kinase receptor 3-ligand, activates thyroglobulin-specific CD4+/CD25+ T cells and suppresses experimental autoimmune thyroiditis. J. Immunol. 170, 5511–5522 - PubMed
Publication types
MeSH terms
Substances
Grants and funding
LinkOut - more resources
Full Text Sources
Other Literature Sources
Research Materials
