. 2010 Nov;177(5):2495-508.
doi: 10.2353/ajpath.2010.100026.

Olfactomedin-4 regulation by estrogen in the human endometrium requires epidermal growth factor signaling

Affiliations

Olfactomedin-4 regulation by estrogen in the human endometrium requires epidermal growth factor signaling

Hellen Dassen et al. Am J Pathol. 2010 Nov.

Abstract

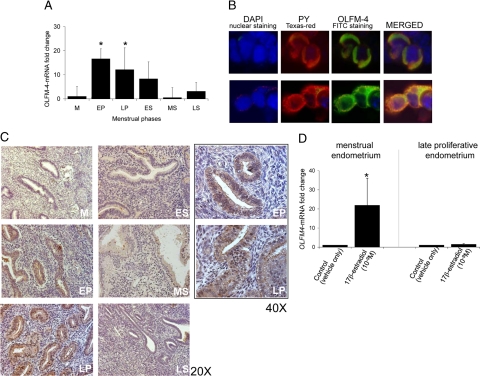
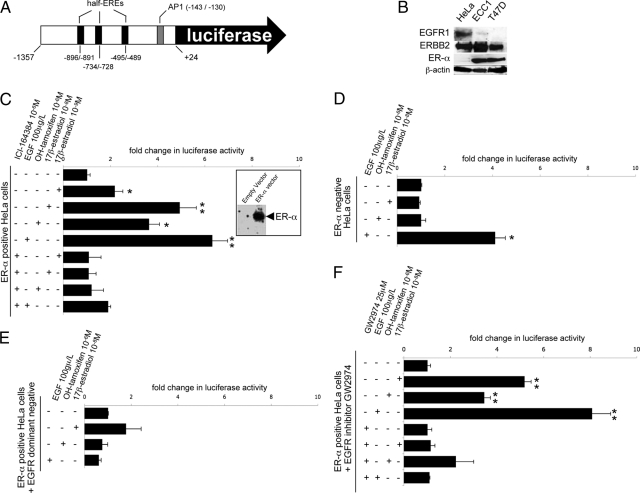
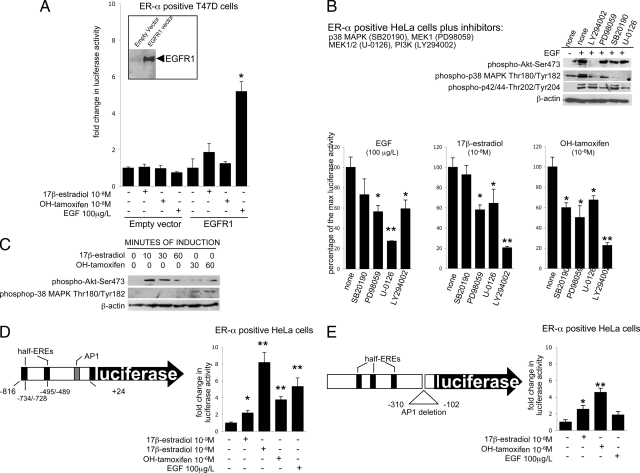
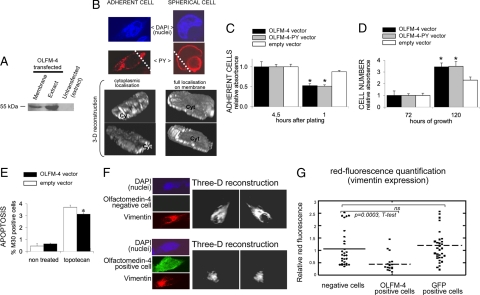
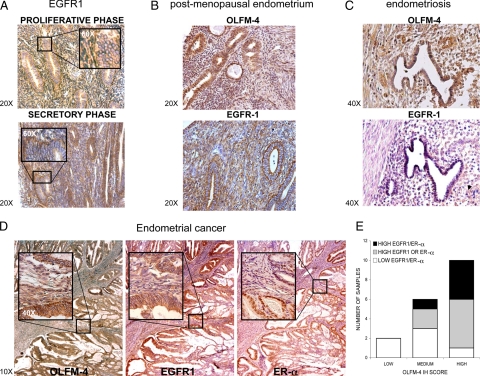
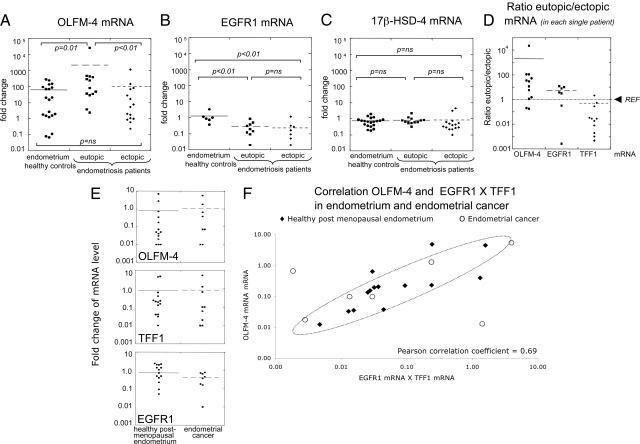
Olfactomedin-4 (OLFM-4) is an extracellular matrix protein that is highly expressed in human endometrium. We have examined the regulation and function of OLFM-4 in normal endometrium and in cases of endometriosis and endometrial cancer. OLFM-4 expression levels are highest in proliferative-phase endometrium, and 17β-estradiol up-regulates OLFM-4 mRNA in endometrial explant cultures. Using the luciferase reporter under control of the OLFM-4 promoter, it was shown that both 17β-estradiol and OH-tamoxifen induce luciferase activity, and epidermal growth factor receptor-1 is required for this estrogenic response. In turn, EGF activates the OLFM-4 promoter, and estrogen receptor-α is needed for the complete EGF response. The cellular functions of OLFM-4 were examined by its expression in OLFM-4-negative HEK-293 cells, which resulted in decreased vimentin expression and cell adherence as well as increased apoptosis resistance. In cases of endometriosis and endometrial cancer, OLFM-4 expression correlated with the presence of epidermal growth factor receptor-1 and estrogen receptor-α (or estrogen signaling). An increase of OLFM-4 mRNA was observed in the endometrium of endometriosis patients. No change in OLFM-4 expression levels were observed in patients with endometrial cancer relative with controls. In conclusion, cross-talk between estrogen and EGF signaling regulates OLFM-4 expression. The role of OLFM-4 in endometrial tissue remodeling before the secretory phase and during the predisposition and early events in endometriosis can be postulated but requires additional investigation.


Figures

Figure 1
Figure 1
OLFM-4 expression in the human endometrium. A: OLFM-4 mRNA expression in healthy cyclic endometrium. M, menstrual phase (n = 12); EP, early proliferative (n = 9); LP, late proliferative (n = 9); ES, early secretory (n = 8); MS, midsecretory (n = 8); and LS, late secretory (n = 2). mRNA levels were determined by quantitative real-time PCR. P < 0.05 versus menstrual phase (Mann-Whitney U-test). B: Specificity of the IMG-5983 antibody for OLFM-4. We confirm perfect colocalization of OLFM-4 (polyclonal IMG-5983, Swine-anti-rabbit-FITC, green) and the PY tag (mouse-anti-2PY MMS-115R, goat-anti-mouse-Texas Red, red). Magnification ×40. C: OLFM-4 protein expression during the menstrual cycle determined by immunohistochemistry. M, menstrual phase; EP, early proliferative; LP, late proliferative; ES, early secretory; MS, midsecretory; and LS, late secretory. D: OLFM-4 mRNA expression in explant cultures of menstrual (n = 8) and late proliferative-phase endometrium (n = 8) exposed for 24 hours to vehicle (0.1% ethanol) or 17β-estradiol (1 nmol/L). mRNA levels were determined by quantitative real-time PCR. P < 0.05 (Wilcoxon signed-rank test).
Figure 2
Figure 2
OLFM-4 is regulated by estrogen and EGFR signaling. A: Scheme of the 1.3-kb OLFM-4 promoter that was cloned in front of the luciferase reporter. Nucleotide numbering as in the study of Chin et al. B: Western blot analysis for ER-α and EGFR1 and ERBB2 in HeLa, ECC1, and T47D cells. C–F: Luciferase response in HeLa cells transfected with the OLFM-4 promoter-luciferase along with: the expression plasmid for ER-α (the panel on the right shows ER-α expression after transfection with ER-α plasmid or with an empty vector) (C), and the ICI-164384 alone had no effect on the luciferase activity (not in figure); the empty vector (without the expression plasmid for ER-α) (D); the ER-α expression plasmid and a dominant-negative variant for of the EGFR (CD-533) (E); and the expression plasmid for ER-α in presence or absence of the EGFR inhibitor GW2974 (F). Bars indicate mean values (n = 3) ± SD. P values were calculated with the t t-test; P <0.05; ∗∗P <0.01. All results were repeated in at least two independent experiments.
Figure 3
Figure 3
Intracellular regulation of the OLFM-4 promoter. A: Luciferase response in T47D cells transfected with the OLFM-4 promoter-luciferase along with the expression plasmid for EGFR1 (the panel on the left shows the EGFR1 expression after transfection with EGFR1 plasmid or with an empty vector). B: Luciferase response of HeLa cells transfected with the OLFM-4 promoter-luciferase and the expression plasmid for ER-α. Cells were preincubated with the inhibitors for p38 MAPK (SB20190, 20 μmol/L), MEK1 (PD98059, 50 μmol/L), MEK1/2 (which is upstream both p38 MAPK and p42/44; U-0126, 10 μmol/L), and PI3K (Ly294002, 10 μmol/L). The Western blot on the top indicates that the inhibitory conditions used were efficient and specific: Ly294002 completely blocked EGF-induced phosphorylation of Akt (downstream of PI3K); PD98059 and U-0126 blocked phosphorylation of p42/44 MAPK; phosphorylation of p38 MAPK is partly inhibited by Ly294002, PD98059, and U-0126 as this kinase lies downstream of both PI3K/Akt and MEK1/2 but not by SB20190, which blocks phosphorylation downstream of p38 MAPK. C: Western blotting indicating the in HeLa cells transiently transfected with the expression plasmid for ER-α, stimulation with both 17β-estradiol and OH-tamoxifen activates the PI3K/Akt signaling, whereas OH-tamoxifen only activates p38 MAPK. D: Luciferase response of HeLa cells transfected with the expression plasmid for ER-α and the OLFM-4 promoter-luciferase, comprising only the 0.8-kb most proximal promoter part (shown on the left). E: Luciferase response of HeLa cells transfected with the expression plasmid for ER-α and the OLFM-4 promoter-luciferase where the AP1 site has been abolished. All inhibitors were also tested alone, and no effect on luciferase activity was observed. Bars indicate mean values (n = 3) ± SD. P values were calculated with the t-test; P < 0.05; ∗∗P < 0.01. All results were repeated in at least two independent experiments.
Figure 4
Figure 4
OLFM-4 re-expression in HEK-293 cells infers apoptosis resistance and reduces cell adherence and vimentin expression. A–E: OLFM-4 was re-expressed in HEK-293 cells (OLFM-4 negative) by transient transfection with the OLFM-4 expression plasmid (or empty vector as control). A: Western blot with antibody IMG-5983 against the native OLFM-4. Equal amounts of protein were loaded on the “extract fractions.” B: Confocal laser scanning microscopy of HEK-293 cells transfected with OLFM-4 cDNA fused to PY tagging and detected with the anti-PY antibody (similar results were obtained with the native nontagged protein). On the left, a cell with predominant cytoplasmic localization of OLFM-4. On the right, membrane localization of OLFM-4. After three-dimensional reconstruction (ImageJ program), cells were (virtually) sectioned through the plane indicated on the top image (dashed line). The cell on the left is well attached to the plate surface, and staining for OLFM-4 is seen through the cytoplasmic section (Cyt). On the right, the OLFM-4 protein is fully localized on the membrane, which is accompanied by detachment (spherical shape) of the cell. We exclude that the rounded shape of the cell was associated to apoptosis because nuclear morphology looked normal, and apoptosis was diminished rather than augmented in cells overexpressing OLFM-4 (E). Magnification ×40. C: Adherence of cells to the culture plate is decreased after re-expression of OLFM-4 compared with cells transfected with the empty vector. P < 0.05 versus empty vector, t-test. Transfected cells were seeded on a 24-well plate, and the number of attached cells was determined by 3-[4,5-dimethylthiazol-2-yl]-2,5-diphenyltetrazolium bromide after different periods of time. Four and one-half hours after plating, all cells were seeded. D: The number of viable cells (3-[4,5-dimethylthiazol-2-yl]-2,5-diphenyltetrazolium bromide assay) increased after OLFM-4 re-expression compared with cells transfected with the empty vector. P < 0.05 versus empty vector, t-test. E: M30 staining/FACS analysis indicating that HEK-293 cells re-expressing OLFM-4 are more resistant to topotecan-induced apoptosis compared with cells transfected with the empty vector. P < 0.05 versus empty vector, t-test. F: HEK-293 cells were transiently transfected with OLFM-4 cDNA and costained for OLFM-4 (FITC-green) and vimentin (Texas Red). Confocal laser scanning microscopy was used to visualize and quantify vimentin filament throughout the whole volume of cells that re-expressed OLFM-4 and cells that did not. The ImageJ program was used to make three-dimensional images. Magnification ×40. G: Quantification of the vimentin expression in cells transfected as described in F that were positive or negative for OLFM-4 expression. The same experiment was performed by transfecting HEK-293 cells with GFP expression plasmid, and no reduction in vimentin expression could be observed (GFP-positive cells).
Figure 5
Figure 5
OLFM-4 and EGFR1 expression in endometriosis and endometrial cancer. A: EGFR1 expression in healthy premenopausal endometrium. Enlarged panels (×60) show the membrane expression of EGFR1. B: OLFM-4 and EGFR1 expression in postmenopausal endometrium. C: OLFM-4 and EGFR1 expression in endometriosis lesions. Little expression of EGFR1 is evident (area indicated with the arrowhead). D: OLFM-4, EGFR1, and ER-α expression in endometrial cancer. E: Correlation between OLFM-4, EGFR1, and ER-α expression in endometrial cancer (n = 18 biopsies from the pathological anatomy national automated archive (PALGA) collection; 3 of the 21 samples from this collection were not stained for OLFM-4, EGFR1, and ER-α because of lack of material). Protein expression was semiquantitatively assessed by calculating a staining index as described earlier.40 Afterward, samples were grouped in three categories for OLFM-4 expression (low, medium, high; x-axis) and in two for EGFR1 and ER-α (low and high). A combination of different expression levels of EGFR1 and ER-α are indicated with white, gray, and black. IH SCORE = staining index.
Figure 6
Figure 6
mRNA levels of OLFM-4, EGFR1, and TFF1 in endometriosis and endometrial cancer. A: OLFM-4 mRNA levels in the endometrium of healthy controls and ectopic/eutopic endometrium of endometriosis patients (statistic significance was maintained after removal of the outsider sample with a fold change >104 in the “eutopic” group). B: EGFR1 mRNA levels in the endometrium of healthy controls and ectopic/eutopic endometrium of endometriosis patients. C: 17β-HSD4 mRNA in the endometrium of healthy controls and ectopic/eutopic endometrium of endometriosis patients. This enzyme is known to be expressed at comparable levels in the eutopic and ectopic endometrium, and it was used as a control for the presence of endometrial tissue in the ectopic lesions. D: Ratios between the levels of mRNA in the eutopic versus the corresponding ectopic endometrium (matched samples in each patient) for OLFM-4, EGFR1, and TFF1. The levels in the eutopic tissues were set to one (REF, indicated); therefore, a value higher than one indicates that in that patient the level of expression of the gene under investigation is higher inside the uterus than in the lesion; vice versa, a value lower than one indicates higher expression in the lesion compared to the endometrium at its normal location. E: OLFM-4, TFF1, and EGFR1 mRNA levels in the endometrium of postmenopausal healthy controls and endometrial cancer (none is significantly different between the two groups). F: Correlation between OLFM-4 mRNA levels and the product of EGFR1 and TFF1 mRNA levels in endometrium of healthy postmenopausal women (R2 value = 0.3) and endometrial cancer (R2 value = 0.8). All mRNA values were calculated by quantitative real-time PCR and were normalized using cyclophilin as a housekeeping gene. Results did not change when β-actin was used for normalization; data not shown). Nonparametric Mann-Whitney U statistical test was used and P values are indicated. Ns, nonsignificant.

Similar articles

Cited by

References

    1. Punyadeera C, Dassen H, Klomp J, Dunselman G, Kamps R, Dijcks F, Ederveen A, de Goeij A, Groothuis P. Oestrogen-modulated gene expression in the human endometrium. Cell Mol Life Sci. 2005;62:239–250. - PMC - PubMed
    1. Zhang J, Liu WL, Tang DC, Chen L, Wang M, Pack SD, Zhuang Z, Rodgers GP. Identification and characterization of a novel member of olfactomedin-related protein family, hGC-1, expressed during myeloid lineage development. Gene. 2002;283:83–93. - PubMed
    1. Liu W, Chen L, Zhu J, Rodgers GP. The glycoprotein hGC-1 binds to cadherin and lectins. Exp Cell Res. 2006;312:1785–1797. - PubMed
    1. Zhang X, Huang Q, Yang Z, Li Y, Li CY. GW112, a novel antiapoptotic protein that promotes tumor growth. Cancer Res. 2004;64:2474–2481. - PubMed
    1. Oue N, Aung PP, Mitani Y, Kuniyasu H, Nakayama H, Yasui W. Genes involved in invasion and metastasis of gastric cancer identified by array-based hybridization and serial analysis of gene expression. Oncology. 2005;69 Suppl 1:17–22. - PubMed

MeSH terms