

doi: 10.1088/0031-9155/55/22/016.
Epub 2010 Nov 3.
Integration of image exposure time into a modified laser speckle imaging method
Affiliations
- PMID: 21048287
- PMCID: PMC3311822
- DOI: 10.1088/0031-9155/55/22/016
Item in Clipboard
Integration of image exposure time into a modified laser speckle imaging method
Phys Med Biol.
.
Abstract
Speckle-based methods have been developed to characterize tissue blood flow and perfusion. One such method, called modified laser speckle imaging (mLSI), enables computation of blood flow maps with relatively high spatial resolution. Although it is known that the sensitivity and noise in LSI measurements depend on image exposure time, a fundamental disadvantage of mLSI is that it does not take into account this parameter. In this work, we integrate the exposure time into the mLSI method and provide experimental support of our approach with measurements from an in vitro flow phantom.
Figures
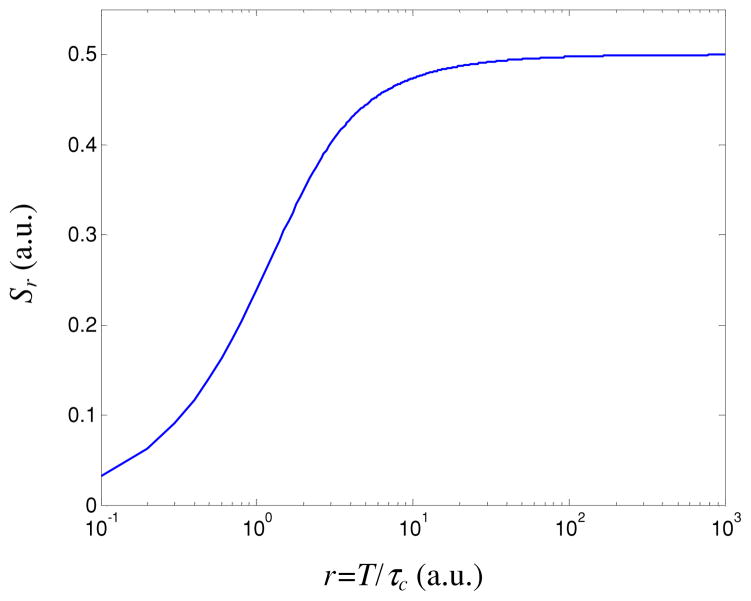
Sensitivity as a function of the number of coherence intervals captured over unit of time (i.e. 1/Nt).
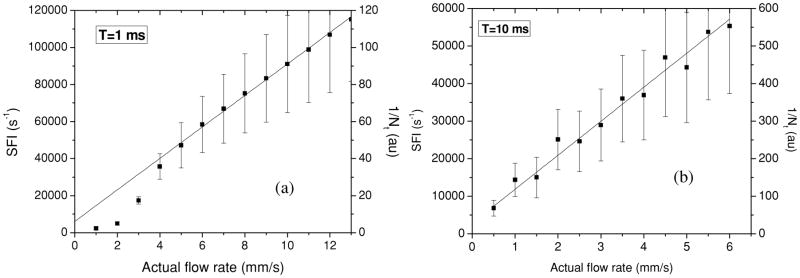
(a) Both SFI and 1/Nt values maintain a linear relationship to the actual flow rate for an actual flow rate greater than 5 mm s−1 and an image exposure time of 1 ms. For an actual flow rate less than 5 mm s−1, it is necessary to employ a longer exposure time to achieve a linear response as demonstrated in (b) for T = 10 ms.

(a) 1/Nt and (b) SFI values as a function of the actual velocity for four exposure times (T). Note that, for a given actual flow rate, the 1/Nt value depends on exposure time, while the SFI value is unaffected.
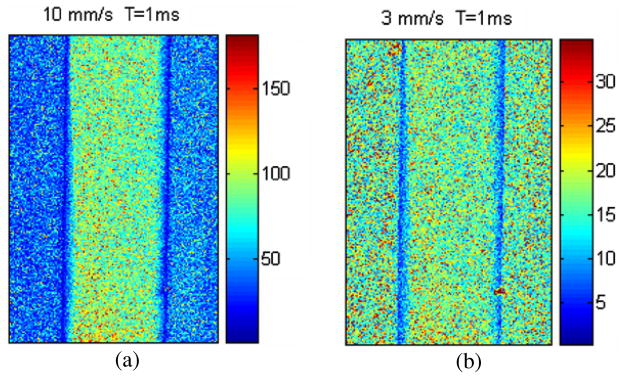
Maps of in vitro flow rates predicted with the mLSI model for actual flow rates of (a) 10 mm s−1 and (b) 3 mm s−1.
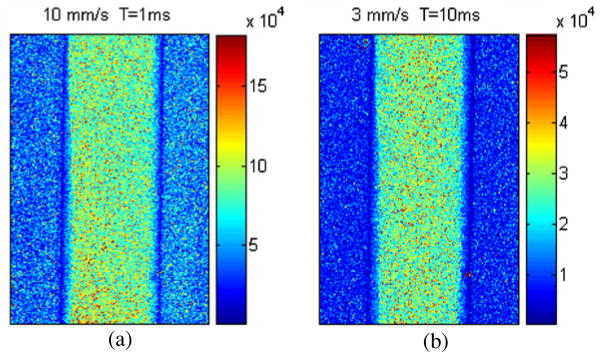
Maps of in vitro flow rate predicted with our mLSI model (equation (5)) for actual flow rates of (a) 10 mm s−1 and (b) 3 mm s−1. Exposure times of 1 and 10 ms were used to work within the linear response range of our instrument for the two actual flow rates.
Similar articles
-
Fluctuations of temporal contrast in laser speckle imaging of blood flow.Opt Lett. 2018 Nov 1;43(21):5214-5217. doi: 10.1364/OL.43.005214. Opt Lett. 2018. PMID: 30382969
-
Photothermal laser speckle imaging.Opt Lett. 2014 Sep 1;39(17):5006-9. doi: 10.1364/OL.39.005006. Opt Lett. 2014. PMID: 25166060 Free PMC article.
-
New insights into image processing of cortical blood flow monitors using laser speckle imaging.IEEE Trans Med Imaging. 2007 Jun;26(6):833-42. doi: 10.1109/TMI.2007.892643. IEEE Trans Med Imaging. 2007. PMID: 17679334
-
Advances in laser speckle imaging: From qualitative to quantitative hemodynamic assessment.J Biophotonics. 2024 Jan;17(1):e202300126. doi: 10.1002/jbio.202300126. Epub 2023 Oct 3. J Biophotonics. 2024. PMID: 37545037 Review.
-
Laser Speckle Imaging to Monitor Microvascular Blood Flow: A Review.IEEE Rev Biomed Eng. 2016;9:106-20. doi: 10.1109/RBME.2016.2532598. Epub 2016 Feb 24. IEEE Rev Biomed Eng. 2016. PMID: 26929060 Review.
Cited by
-
Rapid monitoring of cerebral ischemia dynamics using laser-based optical imaging of blood oxygenation and flow.Biomed Opt Express. 2012 Apr 1;3(4):777-91. doi: 10.1364/BOE.3.000777. Epub 2012 Mar 27. Biomed Opt Express. 2012. PMID: 22574265 Free PMC article.
References
-
- Ayata C, Dunn AK, Gursoy-Ozdemir Y, Huang Z, Boas DA, Moskowitz MA. Laser speckle flowmetry for the study of cerebrovascular physiology in normal and ischemic mouse cortex. J Cereb Blood Flow Metab. 2004;24:744–755. - PubMed
-
- Bandyopadhyay R, Gittings AS, Suh SS, Dixon PK, Durian DJ. Speckle-visibility spectroscopy: a tool to study time-varying dynamics. Rev Sci Instrum. 2005;76:093110.
-
- Bolay H, Reuter U, Dunn AK, Huang ZH, Boas DA, Moskowitz MA. Intrinsic brain activity triggers trigeminal meningeal afferents in a migraine model. Nat Med. 2002;8:136–42. - PubMed
-
- Briers JD, Richards G, He XW. Capillary blood flow monitoring using laser speckle contrast analysis (LASCA) J Biomed Opt. 1999;4:164–75. - PubMed