. 2010 Jul 15:2010:302731.
doi: 10.4061/2010/302731.

Kinetics of Methylation by EcoP1I DNA Methyltransferase

Affiliations

Kinetics of Methylation by EcoP1I DNA Methyltransferase

Shivakumara Bheemanaik et al. Enzyme Res. .

Abstract

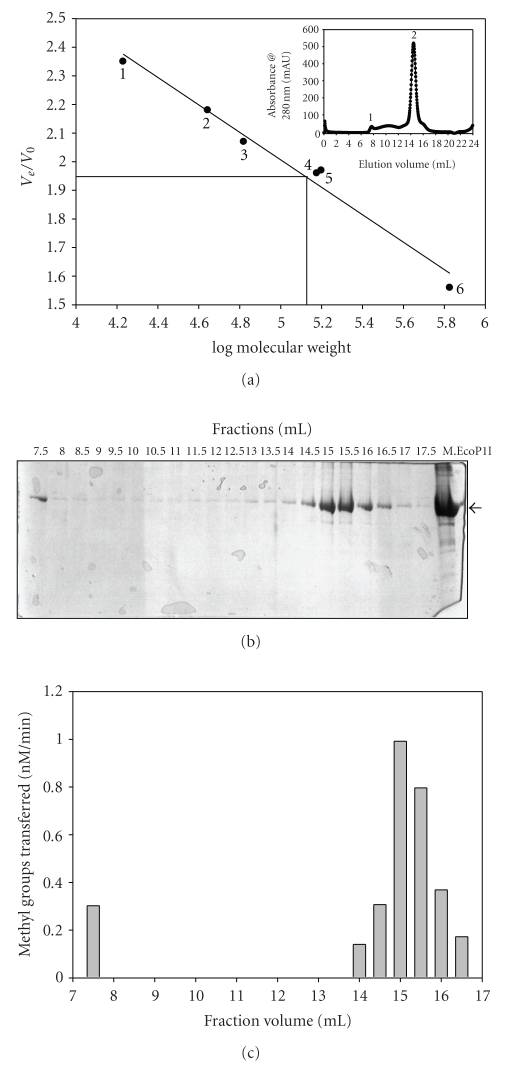
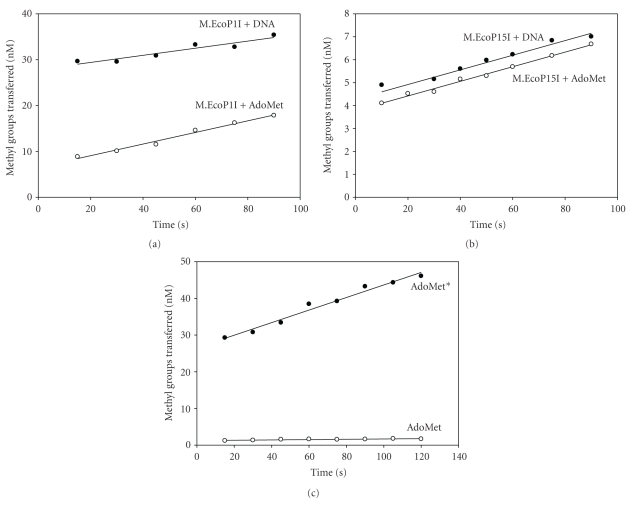
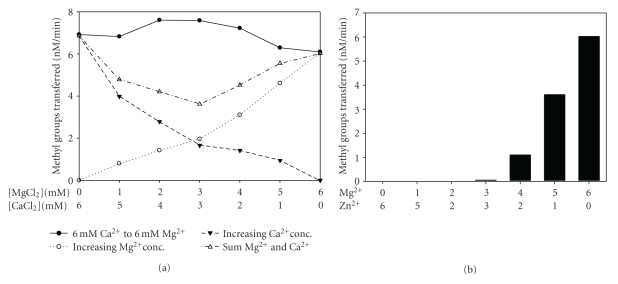
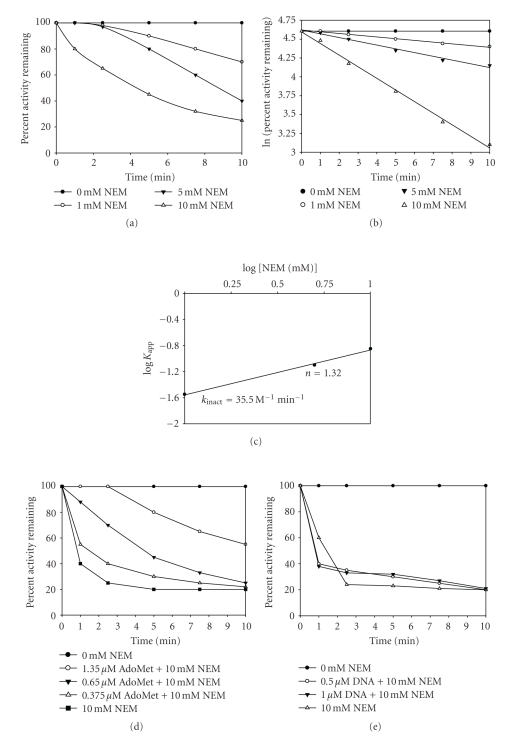
EcoP1I DNA MTase (M.EcoP1I), an N(6)-adenine MTase from bacteriophage P1, is a part of the EcoP1I restriction-modification (R-M) system which belongs to the Type III R-M system. It recognizes the sequence 5'-AGACC-3' and methylates the internal adenine. M.EcoP1I requires Mg(2+) for the transfer of methyl groups to DNA. M.EcoP1I is shown to exist as dimer in solution, and even at high salt concentrations (0.5 M) the dimeric M.EcoP1I does not dissociate into monomers suggesting a strong interaction between the monomer subunits. Preincubation and isotope partitioning studies with M.EcoP1I indicate a kinetic mechanism where the duplex DNA binds first followed by AdoMet. Interestingly, M.EcoP1I methylates DNA substrates in the presence of Mn(2+) and Ca(2+) other than Mg(2+) with varying affinities. Amino acid analysis and methylation assays in the presence of metal ions suggest that M.EcoP1I has indeed two metal ion-binding sites [(358)ID(x)(n) … ExK(401) and (600)DxDxD(604) motif]. EcoP1I DNA MTase catalyzes the transfer of methyl groups using a distributive mode of methylation on DNA containing more than one recognition site. A chemical modification of EcoP1I DNA MTase using N-ethylmaleimide resulted in an irreversible inactivation of enzyme activity suggesting the possible role of cysteine residues in catalysis.


Figures

Figure 1
Figure 1
Determination of the molecular mass of M.EcoP1I by size-exclusion chromatography under nondenaturing conditions. (a) The standard curve Ve/Vo versus log molecular weight was derived from the elution profiles of the standard molecular weight markers with Ve corresponding to the peak elution volume of the protein and Vo representing the void volume of the column determined using Blue dextran (2,000,000 kDa). The peak position of M.EcoP1I is indicated by a line: (1) horse myoglobin (17 kDa); (2) chicken ovalbumin (44 kDa); (3) bovine serum albumin (66 kDa); (4) M.EcoP15I (150 kDa); (5) γ-Globulin (158 kDa) and thyroglobulin (670 kDa). Inset: elution profile of M.EcoP1I. (b) Fractions were collected after gel-filtration chromatography and analyzed on SDS-PAGE for presence of M.EcoP1I. (c) Methylation activity of M.EcoP1I present in the fractions was checked using filter-binding assays.
Figure 2
Figure 2
Effect of NaCl concentration on the DNA methylation activity of M.EcoP1I. The effect of NaCl concentration (0–200 mM) on the DNA methylation activity (nM of methyl groups transferred per min) of M.EcoP1I (400 nM) was determined using 1 μM pUC19 plasmid DNA and 1 μM of [3H-methyl]AdoMet under standard conditions.
Figure 3
Figure 3
Preincubation analysis of M.EcoP1I and M.EcoP15I. (a) Preincubation analysis of M.EcoP1I. Methylation reactions were carried out in methylation buffer containing 400 nM M.EcoP1I, 1 μM duplex I, or, alternatively, 1 μM [3H-methyl]AdoMet. Methylation in the presence of a preformed M.EcoP1I-DNA binary complex (AdoMet added second) is indicated as filled circles (∙). Similarly, a preformed M.EcoP1I-AdoMet binary complex (DNA added second) is shown as empty circles (∘). 20 μl aliquot of the reaction mixture was removed at a 15-second time interval, and the extent of methyl group incorporation was measured. (b) Preincubation analysis of M.EcoP15I (250 nM) with pUC19 DNA (1 μM) and [3H-methyl]AdoMet (1 μM). Methylation in the presence of a preformed M.EcoP15I-DNA binary complex (AdoMet added second) is indicated as filled circles (∙). Similarly, a preformed M.EcoP15I-AdoMet binary complex (DNA added second) is shown as empty circles (∘). (c) Isotope partitioning analysis of EcoP1I MTase. Methylation reactions were carried out in methylation buffer containing 400 nM M.EcoP1I, 1 μM duplex I, and 1 μM [3H-methyl]AdoMet. Curve 1 (∙, AdoMet*) shows product formation after enzyme was preincubated with 1 μM [3H-methyl]AdoMet, and the reaction was started with addition of DNA and labeled [3H-methyl]AdoMet. Curve 2 (∘, AdoMet) shows product formation after the enzyme was preincubated with 1 μM [3H-methyl]AdoMet and the reaction was started with addition of DNA and unlabeled AdoMet.
Figure 4
Figure 4
Effect of divalent metal ions on methylation activity of M.EcoP1I. Duplex I (1 μM) and [3H-methyl]AdoMet (1 μM) were incubated with M.EcoP1I (400 nM) in the presence of various metal ions (6.4 mM) in methylation buffer. The methylation assay was performed and analyzed using the biotin-avidin micro plate assay as described in Section 2. Metal ions used in the assay are indicated in the histogram. The values represent an average of three determinations and subtracted from background values.
Figure 5
Figure 5
DNA methylation by M.EcoP1I in the presence of two metal ions. (a) Methylation by M.EcoP1I was measured by keeping the total divalent metal ion concentration at 6 mM, that is, from Ca2+ (6 mM) on the left to Mg2+ (6 mM) on the right (∙). pUC19 supercoiled DNA (1 μM) was incubated with M.EcoP1I (400 nM) in the presence of varying concentrations of metal ions; Ca2+ and Mg2+ in methylation buffer and assays were performed as described in Materials and Methods. Methylation assays in the presence of Mg2+ (∘) and Ca2+ (▾) alone are plotted. The plot with open triangle indicated sum of Mg2+ and Ca2+ concentration dependences. (b) Methylation assays were performed in the presence of Mg2+ and Zn2+ to a final concentration of 6 mM. pUC19 plasmid DNA (1 μM) was incubated with M.EcoP1I (400 nM) in the presence of varying concentrations of metal ions, Mg2+ and Zn2+ in methylation buffer without metal ions.
Figure 6
Figure 6
Distributive mode of methylation catalyzed by M.EcoP1I and M.EcoP15I. (a) M.EcoP1I (250 nM) was preincubated at room temperature with 2 μM of biotin-tagged oligonucleotide (duplex II) containing two EcoP1I recognition sites for 5 minutes. After preincubation, the mixture was divided into two sets and to one set; [3H-methyl]AdoMet was added to start the reaction (∙). To the other set, [3H-methyl]AdoMet was added along with 20 μM of nonbiotin-tagged oligonucleotide (duplex III) to chase the methylation reaction (∘). The reaction was monitored at different time intervals and it indicated and analyzed the extent of methylation of biotin-tagged duplex II using biotin-avidin micro plate assay. (b) M.EcoP15I (250 nM) was preincubated at room temperature with 2 μM of biotin-tagged oligonucleotide (duplex II) containing two EcoP15I recognition sites for 5 minutes. The methylation reaction was performed as described in Materials and Methods and monitored the reaction at different time intervals for methylation of biotin-tagged oligonucleotide (duplex II).
Figure 7
Figure 7
Kinetics of inactivation of M. EcoP1I by N-ethylmaleimide. M. EcoP1I (6.6 μM) was incubated at 25°C in 10 mM sodium phosphate (pH 6.8) containing 0–10 mM NEM. At the indicated times, aliquots were withdrawn and assayed for DNA MTase activity using filter binding assay as described Section 2. (a) Time course of inactivation plot was constructed. Control incubations gave no change in activity. (b) The pseudo-first-order rate constants (K app) were calculated from the slopes of the inactivation plot for each concentration of NEM used. (c) Pseudo-first-order plot. The apparent first-order rate constants (K app) were plotted against log[NEM]. The y intercept gives the rate of inactivation of the enzyme (K inact). The slope of the line gives the number of cysteine residues modified (n). Values are averages of triplicate determinations. (d) M.EcoP1I (6.6 μM) was preincubated with 0.375 μM, 0.65 μM, and 1.35 μM [3H-methyl] AdoMet for 10 minutes, followed by addition of 10 mM NEM. Methylation activity of all the samples was analyzed under standard reaction conditions so that the final concentration of AdoMet was the same. (e) M.EcoP1I (6.6 μM) was preincubated with 0.5 μM and 1.0 μM duplex I for 10 minutes, followed by addition of 10 mM NEM. Methylation activities of all samples were analyzed under standard reaction conditions.

Similar articles

Cited by

References

    1. Bickle TA, Krüger DH. Biology of DNA restriction. Microbiological Reviews. 1993;57(2):434–450. - PMC - PubMed
    1. Bheemanaik S, Reddy YVR, Rao DN. Structure, function and mechanism of exocyclic DNA methyltransferases. Biochemical Journal. 2006;399(2):177–190. - PMC - PubMed
    1. Malone T, Blumenthal RM, Cheng X. Structure-guided analysis reveals nine sequence motifs conserved among DNA amino-methyltransferases, and suggests a catalytic mechanism for these enzymes. Journal of Molecular Biology. 1995;253(4):618–632. - PubMed
    1. Hadi SM, Bächi B, Iida S, Bickle TA. DNA restriction-modification enzymes of phage P1 and plasmid p15B. Subunit functions and structural homologies. Journal of Molecular Biology. 1983;165(1):19–34. - PubMed
    1. Bourniquel AA, Bickle TA. Complex restriction enzymes: NTP-driven molecular motors. Biochimie. 2002;84(11):1047–1059. - PubMed

LinkOut - more resources