

Regional brain morphometry predicts memory rehabilitation outcome after traumatic brain injury
- PMID: 21048895
- PMCID: PMC2967347
- DOI: 10.3389/fnhum.2010.00182
Regional brain morphometry predicts memory rehabilitation outcome after traumatic brain injury
Abstract
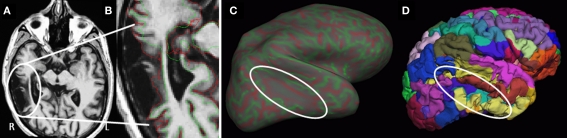
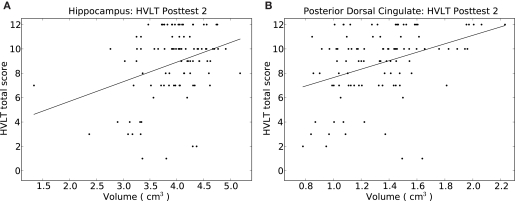
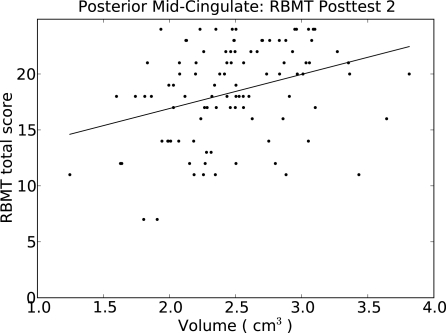
Cognitive deficits following traumatic brain injury (TBI) commonly include difficulties with memory, attention, and executive dysfunction. These deficits are amenable to cognitive rehabilitation, but optimally selecting rehabilitation programs for individual patients remains a challenge. Recent methods for quantifying regional brain morphometry allow for automated quantification of tissue volumes in numerous distinct brain structures. We hypothesized that such quantitative structural information could help identify individuals more or less likely to benefit from memory rehabilitation. Fifty individuals with TBI of all severities who reported having memory difficulties first underwent structural MRI scanning. They then participated in a 12 session memory rehabilitation program emphasizing internal memory strategies (I-MEMS). Primary outcome measures (HVLT, RBMT) were collected at the time of the MRI scan, immediately following therapy, and again at 1-month post-therapy. Regional brain volumes were used to predict outcome, adjusting for standard predictors (e.g., injury severity, age, education, pretest scores). We identified several brain regions that provided significant predictions of rehabilitation outcome, including the volume of the hippocampus, the lateral prefrontal cortex, the thalamus, and several subregions of the cingulate cortex. The prediction range of regional brain volumes were in some cases nearly equal in magnitude to prediction ranges provided by pretest scores on the outcome variable. We conclude that specific cerebral networks including these regions may contribute to learning during I-MEMS rehabilitation, and suggest that morphometric measures may provide substantial predictive value for rehabilitation outcome in other cognitive interventions as well.
Keywords: behavioral neurology; brain trauma; cognitive rehabilitation; memory; morphometrics; semantic clustering; structural neuroimaging.
Figures

Similar articles
-
Fractional anisotropy helps predicts memory rehabilitation outcome after traumatic brain injury.NeuroRehabilitation. 2012;31(3):295-310. doi: 10.3233/NRE-2012-0797. NeuroRehabilitation. 2012. PMID: 23093456
-
Prediction of memory rehabilitation outcomes in traumatic brain injury by using functional magnetic resonance imaging.Arch Phys Med Rehabil. 2008 May;89(5):974-81. doi: 10.1016/j.apmr.2008.02.011. Arch Phys Med Rehabil. 2008. PMID: 18452748
-
Regional brain volume prior to treatment is linked to outcome after cognitive rehabilitation in traumatic brain injury.Neuroimage Clin. 2022;35:103126. doi: 10.1016/j.nicl.2022.103126. Epub 2022 Jul 28. Neuroimage Clin. 2022. PMID: 36002956 Free PMC article. Clinical Trial.
-
Managing cognitive difficulties after traumatic brain injury: a review of online resources for families.Disabil Rehabil. 2019 Aug;41(16):1955-1965. doi: 10.1080/09638288.2018.1451560. Epub 2018 Mar 22. Disabil Rehabil. 2019. PMID: 29564934 Review.
-
Cognitive rehabilitation post traumatic brain injury: A systematic review for emerging use of virtual reality technology.J Clin Neurosci. 2019 Aug;66:209-219. doi: 10.1016/j.jocn.2019.04.026. Epub 2019 May 10. J Clin Neurosci. 2019. PMID: 31085075
Cited by
-
Neuroimaging based biotypes for precision diagnosis and prognosis in cancer-related cognitive impairment.Front Med (Lausanne). 2023 Aug 29;10:1199605. doi: 10.3389/fmed.2023.1199605. eCollection 2023. Front Med (Lausanne). 2023. PMID: 37720513 Free PMC article. Review.
-
Volumetric and shape analyses of subcortical structures in United States service members with mild traumatic brain injury.J Neurol. 2016 Oct;263(10):2065-79. doi: 10.1007/s00415-016-8236-7. Epub 2016 Jul 19. J Neurol. 2016. PMID: 27435967 Free PMC article.
-
Use of Anisotropy, 3D Segmented Atlas, and Computational Analysis to Identify Gray Matter Subcortical Lesions Common to Concussive Injury from Different Sites on the Cortex.PLoS One. 2015 May 8;10(5):e0125748. doi: 10.1371/journal.pone.0125748. eCollection 2015. PLoS One. 2015. PMID: 25955025 Free PMC article.
-
Cognitive training for improving executive function in chemotherapy-treated breast cancer survivors.Clin Breast Cancer. 2013 Aug;13(4):299-306. doi: 10.1016/j.clbc.2013.02.004. Epub 2013 May 4. Clin Breast Cancer. 2013. PMID: 23647804 Free PMC article. Clinical Trial.
-
The Effects of Cognitive Training on Brain Network Activity and Connectivity in Aging and Neurodegenerative Diseases: a Systematic Review.Neuropsychol Rev. 2020 Jun;30(2):267-286. doi: 10.1007/s11065-020-09440-w. Epub 2020 Jun 12. Neuropsychol Rev. 2020. PMID: 32529356 Free PMC article.
References
-
- Bigler E. D., Abildskov T. J., Wilde E. A., McCauley S. R., Li X., Merkley T. L., Fearing M. A., Newsome M. R., Scheibel R. S., Hunter J. V., Chu Z., Levin H. S. (2010). Diffuse damage in pediatric traumatic brain injury: a comparison of automated versus operator-controlled quantification methods. Neuroimage 50, 1017–102610.1016/j.neuroimage.2010.01.003 - DOI - PubMed
Grants and funding
LinkOut - more resources
Full Text Sources