. 2010 Oct 4:4:24.
doi: 10.3389/fncom.2010.00024. eCollection 2010.

Internal representation of task rules by recurrent dynamics: the importance of the diversity of neural responses

Affiliations

Internal representation of task rules by recurrent dynamics: the importance of the diversity of neural responses

Mattia Rigotti et al. Front Comput Neurosci. .

Abstract

Neural activity of behaving animals, especially in the prefrontal cortex, is highly heterogeneous, with selective responses to diverse aspects of the executed task. We propose a general model of recurrent neural networks that perform complex rule-based tasks, and we show that the diversity of neuronal responses plays a fundamental role when the behavioral responses are context-dependent. Specifically, we found that when the inner mental states encoding the task rules are represented by stable patterns of neural activity (attractors of the neural dynamics), the neurons must be selective for combinations of sensory stimuli and inner mental states. Such mixed selectivity is easily obtained by neurons that connect with random synaptic strengths both to the recurrent network and to neurons encoding sensory inputs. The number of randomly connected neurons needed to solve a task is on average only three times as large as the number of neurons needed in a network designed ad hoc. Moreover, the number of needed neurons grows only linearly with the number of task-relevant events and mental states, provided that each neuron responds to a large proportion of events (dense/distributed coding). A biologically realistic implementation of the model captures several aspects of the activity recorded from monkeys performing context-dependent tasks. Our findings explain the importance of the diversity of neural responses and provide us with simple and general principles for designing attractor neural networks that perform complex computation.

Keywords: attractor neural network; mixed selectivity; persistent activity; prefrontal cortex; randomly connected neurons; rule-based behavior.


Figures

Figure 1
Figure 1
A context-dependent task. (A) A typical trial of a simplified version of the WCST, similar to the one used in the monkey experiment (Mansouri et al., 2006, 2007). The subject has to classify visual stimuli either according to their shape or according to their color. Before the trial starts, the subject keeps actively in mind the rule in effect (color or shape). Every event, like the appearance of a visual stimulus, modifies the mental state of the subject. An error signal indicates that it is necessary to switch to the alternative rule. (B) Scheme of mental states (thought balloons) and event-driven transitions (arrows) that enables the subject to perform the simplified WCST. (C) Neural representation of the mental states shown in (A): circles represent neurons, and colors denote their response preferences (e.g., red units respond when Color Rule is in effect). Filled circles are active neurons and black lines are synaptic connections. For simplicity, not all neurons and synaptic connections are drawn.
Figure 2
Figure 2
(A) Impossibility of implementing a context-dependent task in the absence of mixed selectivity neurons. We focus on one neuron encoding Color Rule (red). In the attractors (two panels on the left), the total recurrent synaptic current (arrow) should be excitatory when the Color Rule neuron is active, inhibitory otherwise. In case of rule switching (two panels on the right), generated by the Error Signal neuron (pink), there is a problem as the same external input should be inhibitory (dark blue) when starting from Color Rule and excitatory (orange) otherwise. (B) The effect of an additional neuron with mixed selectivity that responds to the Error Signal only when starting from Shape Rule. Its activity does not affect the attractors (two panels on the left), but it excites Color Rule neurons when switching from Shape Rule upon an Error Signal. In the presence of the mixed selectivity neurons, the current generated by the Error Signal can be chosen to be consistently inhibitory.
Figure 3
Figure 3
(A) Neural network architecture: randomly connected neurons (RCN) are connected both to the recurrent neurons and the external neurons by fixed random weights (brown). Each RCN projects back to the recurrent network by means of plastic synapses (black). Not all connections are shown. (B) Probability that an RCN displays mixed selectivity (on log scale) and hence solves the problem of Figure 2 as a function of f, the average fraction of input patterns to which each RCN responds. Different curves correspond to different coding levels f0 of the representations of the mental states and the external inputs. The peak is always at f = 1/2 (dense RCN representations). (C) Probability that an RCN has mixed selectivity as a function of f, as in (B), for different positive values of the overlap o between the two initial mental states, and the two external inputs corresponding to the spontaneous activity and the event. Again the peak is always at f = 1/2. The curve decays gently as o goes to 1. (D) As in (C), but for negative values of the overlap o, meaning that the patterns representing the mental states are anti-correlated. There are now two peaks, but notice that they remain close to f = 1/2 for all values of o.
Figure 4
Figure 4
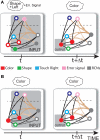
Prescription for determining the plastic synaptic weights. (A) For event-driven transitions the synapses are modified as illustrated in the case of the transition from Shape + Left to Color induced by an Error Signal. The pattern of activity corresponding to the initial attractor (Shape + Left) is imposed to the network. Each neuron is in turn isolated (leftmost red neuron in this example), and its afferent synapses are modified so that the total synaptic current generated by the initial pattern of activity (time t, denoted by INPUT), drives the neuron to the desired activity in the target attractor (OUTPUT at time t + Δt). (B) For the mental states the initial and the target patterns are the same. The figure shows the case of the stable pattern representing the Color mental state. The procedure is repeated for every neuron and every condition.
Figure 5
Figure 5
(A)Distributed/dense representations are the most efficient: total number of neurons (recurrent network neurons + RCNs) needed to implement r = m transitions between m random attractor states (internal mental states) as a function of f, the average fraction of inputs that activate each individual RCN. The minimal value is realized with f = 1/2. The three curves correspond to three different numbers of mental states m (5,10,20). The number of RCNs is 4/5 of the total number of neurons. (B) Total number of needed neurons to implement m random mental states and r transitions which are randomly chosen between mental states, with f = 1/2. The number of needed neurons grows linearly with m. Different curves correspond to different ratios between r and m. The size of the basin of attraction is at least ρB = 0.03 (i.e., all patterns with an overlap larger than о = 1 - 2ρB = 0.94 with the attractor are required to relax back into the attractor). (C) The size of basins of attraction increases with the number of RCNs. The quality of retrieval (fraction of cases in which the network dynamics flows to the correct attractor) is plotted against the distance between the initial pattern of activity and the attractor, that is the maximal level of degradation tolerated by the network to still be able to retrieve the attractor. The four curves correspond to four different numbers of RCNs. In all these simulations the number of recurrent neurons was kept fixed at N = 220 and m = r = 48. (D) Same as (B), but for larger basins of attraction, ρB = 0.10.
Figure 6
Figure 6
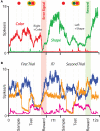
Simulation of a Wisconsin Card Sorting-type Task after a rule shift. (A) Simulated activity as a function of time of two sample neurons of the recurrent network that are rule selective. The first neuron (red) is selective to “color” and the second (green) to “shape”. The events and the mental states for some of the epochs of the two trials are reported above the traces. (B) Same as (A), but for three RCNs.
Figure 7
Figure 7
(A) Minimal scheme of mental states and event-driven transitions for the simplified WCST (same as in Figure 1B). (B) Rule selectivity pattern for 70 simulated cells: for every trial epoch (x-axis) we plotted a black bar when the neuron had a significantly different activity in shape and in color blocks. The neurons are sorted according to the first trial epoch in which they show rule selectivity. (C) Same analysis as in (B), but for spiking activity of single-units recorded in prefrontal cortex of monkeys performing an analog of the WCST (Mansouri et al., 2006). (D) Scheme of mental states and event-driven transitions with multiple states during the inter-trial interval (E) Same as (B), but for the history-dependent scheme in (D). (F) Same as (E), but for the selectivity to the color of the sample (red bars). Short black bars indicate rule selectivity.
Figure 8
Figure 8
Diversity, pre-existence and universality of neurons with mixed selectivity. (A) Extended WCST (eWCST): task switch is driven not only by an error signal, but also by a tone (green arrow). (B,C) All necessary mixed selectivities are pre-existent (i.e., they exist before learning). The simulated network is trained on the WCST of Figure 1D. We show the neural activity in trials preceding learning of eWCST. The neurons in the top panels of (B,C) encode the rule in effect and the motor response Right, as in Figure 6. (B) Shows one trial in which Color Rule is in effect, (C) a trial in which Shape Rule is in effect. The other plots represent the activity of four cells during the same trial in the absence (blue) and in the presence (red) of the tone. Some neurons are selective to the rule, but not to the tone (top). Some others have mixed selectivity to the tone and the rule (two central panels) even when the conjunctions of events are still irrelevant for the task (the network is not trained to solve eWCST). See in particular the neuron in the top central panel, that responds to the tone only when Color Rule is in effect. Finally, there are neurons that are selective to the tone but not to the rule. (D) Selectivity to the rule in effect (black) and to the tone (red) before learning of the eWCST (cf. Figure 7F). There are many neurons with the mixed selectivity that are necessary to solve the eWCST before any learning takes place.
Figure A1
Figure A1
(A) Architecture of the network, reproduced from Figure 2 for convenience. (B) The context dependence problem is equivalent to the XOR (exclusive OR problem). The N-dimensional space of all possible inputs is projected onto the plane described in the text. The circles represent the desired output activity of a specific neuron (in our case a red, Color Rule encoding neuron) in response to the input identified by the location of the circle on the plane. The desired outputs are dictated by the requirements of the conditions corresponding to the attractors (lower quadrants) and the event-driven transitions (upper quadrants). (C) Effects of an additional neuron with pure selectivity to the inner mental states. Left: the neuron (gray) responds to two of the four possible inputs (leftmost points) and hence it has pure selectivity. The response to the two inner mental states (Shape + Left, Color + Left) averaged over the two possible external inputs is represented by two bars above the square. The response to the external inputs averaged over the inner mental states is plotted vertically and it is represented again by two bars. The neuron responds differently and is selective to the inner mental states but not to the external inputs. Center: effects of the introduction of the pure selectivity neuron in the network dynamics. The input space goes from a plane to the third dimension, spanned by the activity of the additional neuron. Two of the circles representing the outputs of the Color Rule neurons (see B) move up to reflect the activity states of the additional neuron. The axes directions are correct, but their position is arbitrary. Right: an RCN with pure selectivity responding to the same input space represented in (B). The position and orientation of the red line is determined by the random synaptic weights. For this particular realization separates two inputs on the left, which are the input patterns activating the RCN. (D) Same as in (C) but for a mixed selectivity neuron.
Figure A2
Figure A2
(A) Density of circles tangent to the planes generated by randomly sampling RCNs with Gaussian synapses and θ = 2. (B) Same as (A), but with θ = 0. (C) Distribution of the radii of tangent circles for different values of the firing threshold θ
Figure A3
Figure A3
Probability of finding an RCN which implements mixed selectivity, therefore allowing to linearly separate the input patterns as a function of the RCN's firing threshold θ. This quantity is calculated in Eq. 17. Different curves correspond to different positive values of the overlap o of the input patterns representing the mental states and the external events.
Figure A4
Figure A4
Probability of finding an RCN which implements mixed selectivity as a function of the RCN's firing threshold θ. This figure is analogous to Figure A3, with the difference that different curves correspond to different negative values of the overlap o of the input patterns representing the mental states and the external events.
Figure A5
Figure A5
Probability p of finding an RCN implementing mixed selectivity as a function of the overlap o between the input patterns for a constant value of the RCN firing threshold θ. We see that by going to negative o we can slightly increase p until a value o = −1/3. At this point θ = 0 stops being a maximum of p.
Figure A6
Figure A6
Probability of finding an RCN which implements mixed selectivity as a function of the RCN's firing threshold θ. Different curves correspond to different negative values of the overlap o of the input patterns representing the mental states and the external events.
Figure A7
Figure A7
(A) Number of RCNs needed to implement m/2 transitions between m random mental states. The number of neurons in the recurrent network is always N = 200. Different curves correspond to different choices of the threshold for activating the RCNs, which, in turn, correspond to a different f (average fraction of inputs that activate the RCNs). (B) Number of needed RCNs as a function of 1/f for a different m. N = 200 as in (A).
Figure A8
Figure A8
The number of required learning epochs decays as the number of RCNs increases for a fixed minimal stability parameter γ = 0.5. The number of epochs is plotted for four different levels of capacity (m = 10,20,40,80). The solid lines are the power law curves fitted to the datapoints (the power ranges from approximately −1.5 to −2.2 as m increased). The asymptotic number of learning epochs seems to increase lineary with the number of transitions and the number of attractors m, ranging from approximately 12–40 (not visible in the plot), for m = 10 and 80, respectively. Parameters as statistics of the neural patterns are as in Figure A7.
Figure A9
Figure A9
Stochastic event-driven transitions. A larger amount of noise is injected in the simulated neurons of Figure 6. The transitions between the two mental states corresponding to the rules become stochastic. (A) The neural activity of four highly selective neurons (to color rule, shape rule, touch left, and touch right) is plotted as a function of time. In the top panel the absence of reward induces a transition from one rule to the other, whereas in the bottom panel, under the same conditions, the transition does not occur. (B) Difference in activity between two neurons selective to shape and color rule, respectively, for several occurrences of the Error Signal event. In half of the case the transition occurred, and in the other half it did not. (C) Probability of completing a transition as a function of normalized noise (noise strength is defined as unitary in correspondence to a 1/2 transition probability).

References

    1. Ackley D. H., Hinton G. E., Sejnowski T. J. (1985). A learning algorithm for Boltzmann machines. Cogn. Sci. 9, 147–16910.1207/s15516709cog0901_7 - DOI
    1. Albus J. (1971). A theory of cerebellar function. Math. Biosci. 10, 25–6110.1016/0025-5564(71)90051-4 - DOI
    1. Amit D. J. (1988). Neural networks counting chimes. Proc. Natl. Acad. Sci. U.S.A. 85, 2141–214510.1073/pnas.85.7.2141 - DOI - PMC - PubMed
    1. Amit D. J. (1989). Modeling Brain Function. New York, NY: Cambridge University Press
    1. Asaad W. F., Rainer G., Miller E. K. (1998). Neural activity in the primate prefrontal cortex during associative learning. Neuron 21, 1399–140710.1016/S0896-6273(00)80658-3 - DOI - PubMed