

Economic inequalities in maternal health care: prenatal care and skilled birth attendance in India, 1992-2006
- PMID: 21048964
- PMCID: PMC2965095
- DOI: 10.1371/journal.pone.0013593
Economic inequalities in maternal health care: prenatal care and skilled birth attendance in India, 1992-2006
Abstract
Background: The use of maternal health care is limited in India despite several programmatic efforts for its improvement since the late 1980's. The use of maternal health care is typically patterned on socioeconomic and cultural contours. However, there is no clear perspective about how socioeconomic differences over time have contributed towards the use of maternal health care in India.
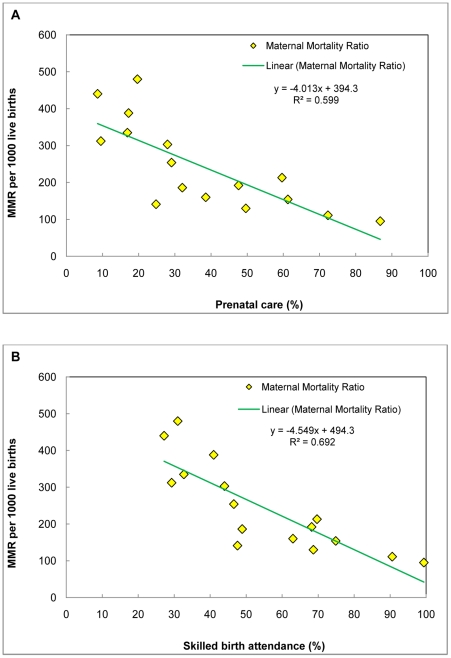
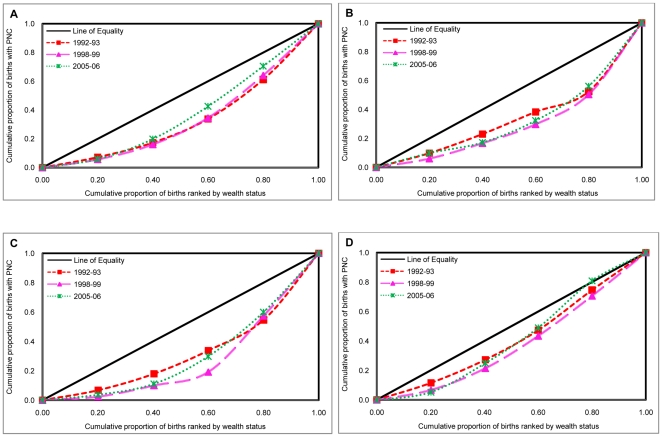
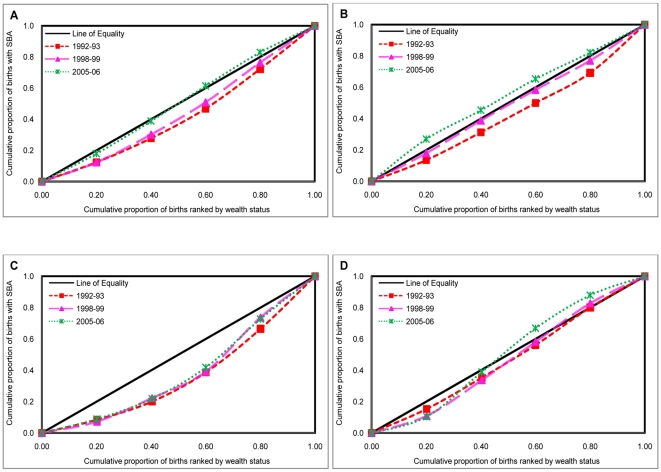
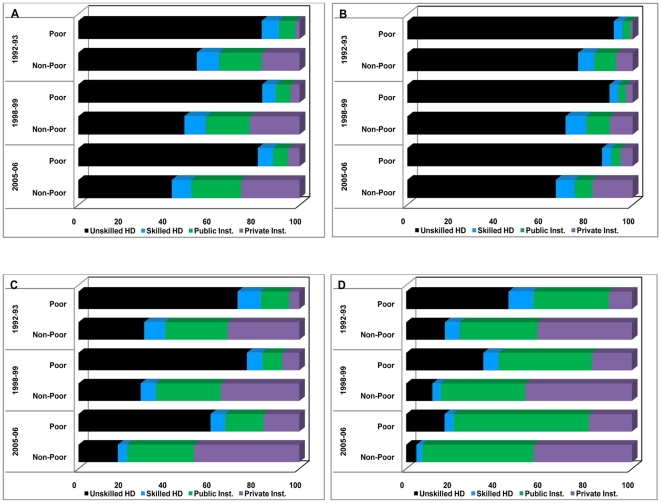
Methodology/principal findings: Using data from three rounds of National Family Health Survey (NFHS) conducted during 1992-2006, we analyse the trends and patterns in utilization of prenatal care (PNC) in first trimester with four or more antenatal care visits and skilled birth attendance (SBA) among poor and nonpoor mothers, disaggregated by area of residence in India and three contrasting provinces, namely, Uttar Pradesh, Maharashtra and Tamil Nadu. In addition, we investigate the relative contribution of public and private health facilities in meeting the demand for SBA, especially among poor mothers. We also examine the role of salient socioeconomic, demographic and cultural factors in influencing aforementioned outcomes. Bivariate analyses, concentration curve and concentration index, logistic regression and multinomial logistic regression models are used to understand the trends, patterns and predictors of the two outcome variables. Results indicate sluggish progress in utilization of PNC and SBA in India and selected provinces during 1992-2006. Enormous inequalities in utilization of PNC and SBA were observed largely to the disadvantage of the poor. Multivariate analysis suggests growing inequalities in utilization of the two outcomes across different economic groups.
Conclusions: The use of PNC and SBA remains disproportionately lower among poor mothers in India irrespective of area of residence and province. Despite several governmental efforts to increase access and coverage of delivery services to poor, it is clear that the poor (a) do not use SBA and (b) even if they had SBA, they were more likely to use the private providers.
Conflict of interest statement
Figures
References
-
- Ronsmans C, Graham WJ. Maternal Mortality: who, when, where and why? Lancet. 2006;368:1189–200. - PubMed
-
- Rosenfield A, Maine D. Maternal Mortality- a neglected tragedy: where is the M in MCH? Lancet. 1985;2:83–85. - PubMed
-
- Freedman L, Wirth M, Waldman R, Chowdhury M, Rosanfield A. Background paper of the task force on child health and maternal health. Millennium Project. Commissioned by UN Secretary General and supported by UN Development Group. 2003. Available: http://www.unmillenniumproject.org/documents/tf04apr18.pdf. Accessed 2010 April 23.
-
- United Nations Children's Fund (UNICEF) The State of the World's Children Report-Maternal and Neoborn Health. New York, USA: 2008.
-
- Freedman LP, Graham WJ, Brazier E, Smith JM, Ensor T, et al. Practical lessons from global safe motherhood initiatives: time for a new focus on implementation. Lancet. 2007;370:1383–91. - PubMed
Publication types
MeSH terms
Grants and funding
LinkOut - more resources
Full Text Sources
Medical
