. 2010 Oct 26;5(10):e15406.
doi: 10.1371/journal.pone.0015406.

Microbiome profiling by illumina sequencing of combinatorial sequence-tagged PCR products

Affiliations

Microbiome profiling by illumina sequencing of combinatorial sequence-tagged PCR products

Gregory B Gloor et al. PLoS One. .

Abstract

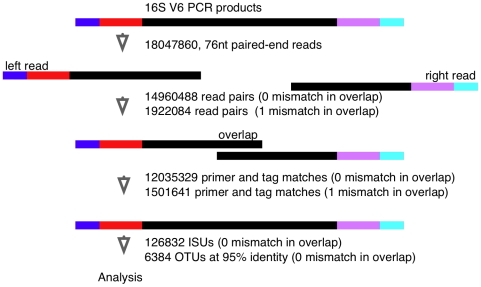
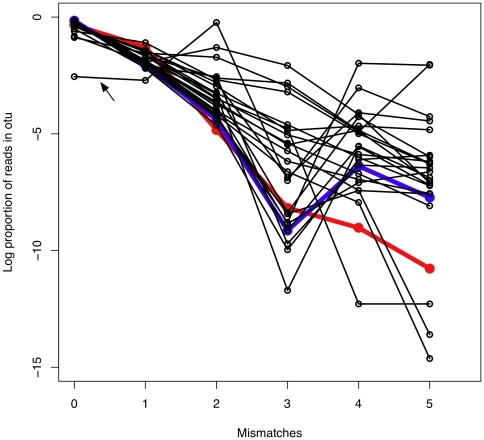
We developed a low-cost, high-throughput microbiome profiling method that uses combinatorial sequence tags attached to PCR primers that amplify the rRNA V6 region. Amplified PCR products are sequenced using an Illumina paired-end protocol to generate millions of overlapping reads. Combinatorial sequence tagging can be used to examine hundreds of samples with far fewer primers than is required when sequence tags are incorporated at only a single end. The number of reads generated permitted saturating or near-saturating analysis of samples of the vaginal microbiome. The large number of reads allowed an in-depth analysis of errors, and we found that PCR-induced errors composed the vast majority of non-organism derived species variants, an observation that has significant implications for sequence clustering of similar high-throughput data. We show that the short reads are sufficient to assign organisms to the genus or species level in most cases. We suggest that this method will be useful for the deep sequencing of any short nucleotide region that is taxonomically informative; these include the V3, V5 regions of the bacterial 16S rRNA genes and the eukaryotic V9 region that is gaining popularity for sampling protist diversity.


Conflict of interest statement

Competing Interests: The authors have declared that no competing interests exist.

Figures

Figure 1
Figure 1. Expected amplified product size using constant regions flanking eubacterial variable regions.
Figure 2
Figure 2. Conceptual workflow of the data analysis.
PCR products derived from the eubacterial V6 rRNA region were sequenced on a single paired-end Illumina run. Reads were filtered for quality, overlapped and clustered as outlined in the text. Only reads with 0 mismatches in the overlapping region were used for further analysis.
Figure 3
Figure 3. The proportion of reads in the 25 most abundant OTUs clustered at 92% identity as a function of the number of differences with the seed ISU.
The red line shows the plot for the concatenated primer sequences, and the blue line shows the plot for the OTU containing the most abundant ISU.
Figure 4
Figure 4. Neighbour-joining tree derived from Levenshtein distance between the 108 most abundant ISU sequences.
ISUs clustered into OTUs at 95% identity are connected with red branches and ISU sequences clustered at 92% identity are connected with green branches. The seed sequence for each 95% identity OTU cluster is identified by a red dot.
Figure 5
Figure 5. Quality scores for all overlapped 120 bp composite reads.
The formula image scores a log-odds score of the likelihood of error in the base call, higher formula image scores represent lower likelihoods of error . They are expected to decrease with distance from the left or right sequencing primer, and to be highest in the region of perfect overlap because formula image scores are additive.
Figure 6
Figure 6. The frequency of each nucleotide observed at each position in the left and right primers derived from the Illumina dataset.
There are formula image 
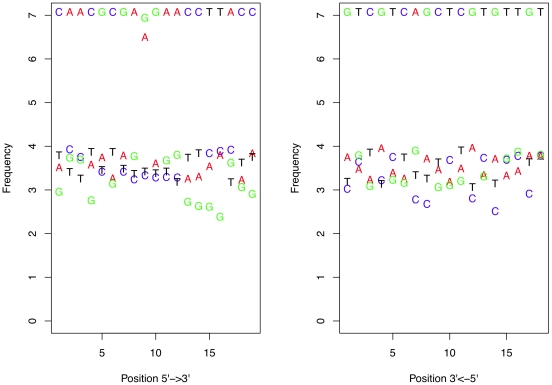
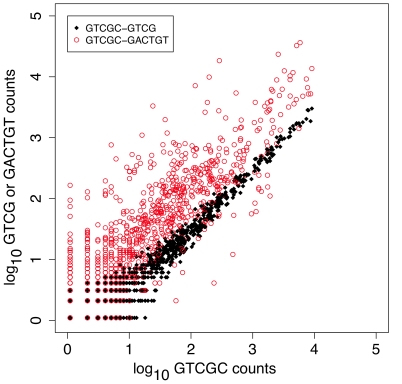
million sequences, and the difference in frequency between the correct and altered nucleotide is relatively constant. Note that the errors are at the same frequency at each end of the primers.
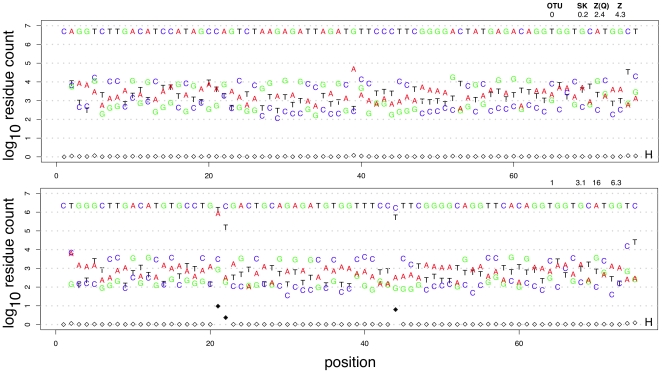
Figure 7
Figure 7. The sequence variation in OTU 0 and OTU 1.
The plot shows the number of times that each nucleotide occurred at each position in two example OTUs.
Figure 8
Figure 8. Boxplot summaries of the difference between the frequency of the most in common residue at each position and the frequency of each sequence variant.
The OTU numbers are given at the top of the graph.
Figure 9
Figure 9. Plot of the reproducibility between and within samples.
The black-filled circles plot within-sample variation, and the red circles plot the between-sample variation for the GTCGC tag. The count of sequences composing OTUs clustered at 95% identity for samples containing the GTCGC tag and the GTCG N-1 tag are in black. This shows the technical replication of the data when amplified from the same sample in the same tube. The open red circles plot the correspondence for between-sample OTU counts.
Figure 10
Figure 10. An example rarefaction curve.
The top panel shows rarefaction curves generated for sample 1 by resampling with replacement either all OTUs or ISUs, or OTUs and ISUs where at least 3 reads were observed. The bottom panel shows the rarefaction curve and the 95% and 99% confidence interval for all OTUs in sample 1. Rarefaction curves for all 272 samples are given in Supplementary Figure S2.
Figure 11
Figure 11. Correspondence between Chao1, ACE and rarefaction curves for the 272 samples.
The X and Y axes show the fraction of species that were found in each sample for the two estimates. Red-filled circles highlight those samples where the limit rarefaction value was less than 0.97.
Figure 12
Figure 12. Plot of the number of distinct ISU or OTU classes in each sample as a function of the number of reads.
The number of ISU classes increases with the number of reads, but the number of OTU classes becomes constant above 20000–30000 reads.
Figure 13
Figure 13. DGGE analysis of selected samples.
Panel A shows representative PCR amplicons from 3 of 20 clinical samples (Subjects 40, 48 and 89) were electrophoresed on a denaturing gradient gel. Bands were excised, sequenced and identified as in the Materials and Methods. Bands are labeled as follows: le = Leptotrichia amnionii; in = Lactobacillus iners; ga = Gardnerella vaginalis; cr = Lactobacillus crispatus; pr = Prevotella amnii (also named P. amniotica). Panel B shows a Venn diagram of the organisms identified by Illumina sequencing of the V6 rRNA region and by sequencing DGGE bands amplified from the V3 rRNA region.

References

    1. Andersson AF, Lindberg M, Jakobsson H, Bäckhed F, Nyrén P, et al. Comparative analysis of human gut microbiota by barcoded pyrosequencing. PLoS One. 2008;3:e2836. - PMC - PubMed
    1. Lauber CL, Hamady M, Knight R, Fierer N. Pyrosequencing-based assessment of soil ph as a predictor of soil bacterial community structure at the continental scale. Appl Environ Microbiol. 2009;75:5111–20. - PMC - PubMed
    1. Polymenakou PN, Lampadariou N, Mandalakis M, Tselepides A. Phylogenetic diversity of sediment bacteria from the southern cretan margin, eastern mediterranean sea. Syst Appl Microbiol. 2009 Feb;32:17–26. - PubMed
    1. Hamady M, Knight R. Microbial community profiling for human microbiome projects: Tools, techniques, and challenges. Genome Res. 2009;19:1141–52. - PMC - PubMed
    1. Amaral-Zettler LA, McCliment EA, Ducklow HW, Huse SM. A method for studying protistan diversity using massively parallel sequencing of v9 hypervariable regions of small-subunit ribosomal rna genes. PLoS One. 2009;4:e6372. - PMC - PubMed

Publication types