. 2010 Oct 26;5(10):e13481.
doi: 10.1371/journal.pone.0013481.

Glial innate immunity generated by non-aggregated alpha-synuclein in mouse: differences between wild-type and Parkinson's disease-linked mutants

Affiliations

Glial innate immunity generated by non-aggregated alpha-synuclein in mouse: differences between wild-type and Parkinson's disease-linked mutants

Cintia Roodveldt et al. PLoS One. .

Abstract

Background: Parkinson's disease (PD) is a progressive neurodegenerative disorder characterized pathologically by the presence in the brain of intracellular protein inclusions highly enriched in aggregated alpha-synuclein (α-Syn). Although it has been established that progression of the disease is accompanied by sustained activation of microglia, the underlying molecules and factors involved in these immune-triggered mechanisms remain largely unexplored. Lately, accumulating evidence has shown the presence of extracellular α-Syn both in its aggregated and monomeric forms in cerebrospinal fluid and blood plasma. However, the effect of extracellular α-Syn on cellular activation and immune mediators, as well as the impact of familial PD-linked α-Syn mutants on this stimulation, are still largely unknown.

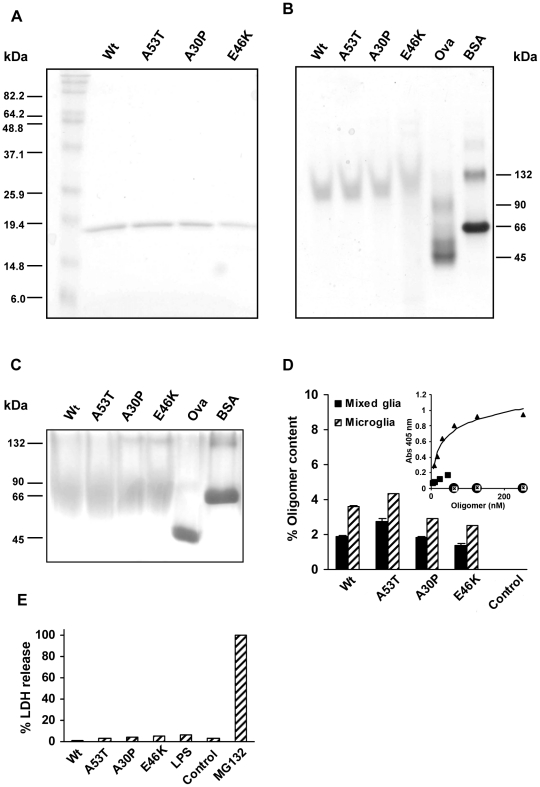
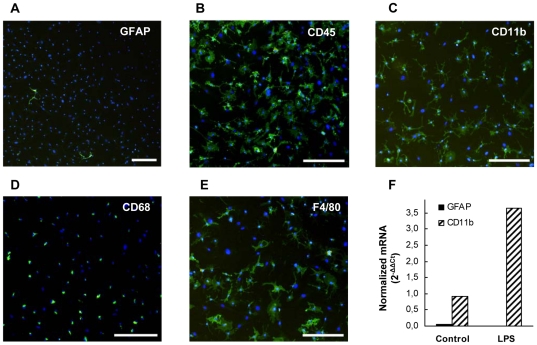
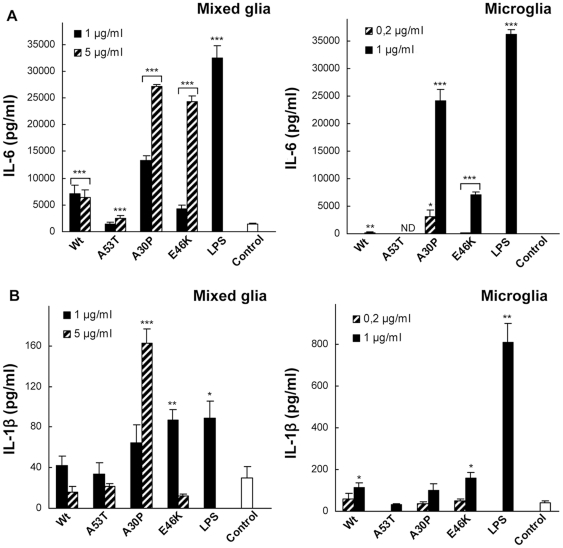
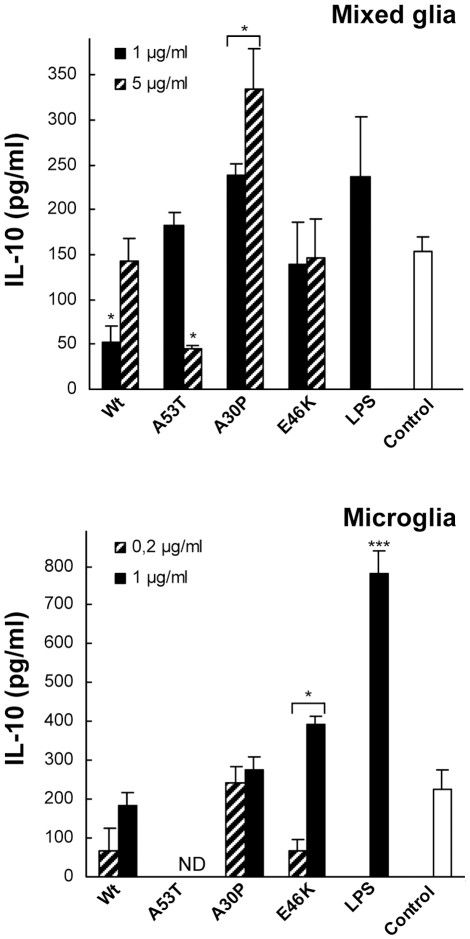
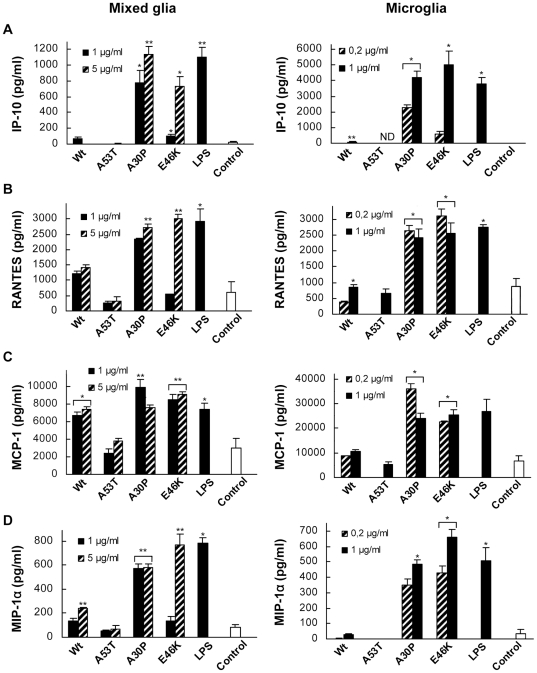
Methods and findings: In this work, we have compared the activation profiles of non-aggregated, extracellular wild-type and PD-linked mutant α-Syn variants on primary glial and microglial cell cultures. After stimulation of cells with α-Syn, we measured the release of Th1- and Th2- type cytokines as well as IP-10/CXCL10, RANTES/CCL5, MCP-1/CCL2 and MIP-1α/CCL3 chemokines. Contrary to what had been observed using cell lines or for the case of aggregated α-Syn, we found strong differences in the immune response generated by wild-type α-Syn and the familial PD mutants (A30P, E46K and A53T).

Conclusions: These findings might contribute to explain the differences in the onset and progression of this highly debilitating disease, which could be of value in the development of rational approaches towards effective control of immune responses that are associated with PD.


Conflict of interest statement

Competing Interests: The authors have declared that no competing interests exist.

Figures

Figure 1
Figure 1. Determination of the purity, oligomeric state and cytotoxic effects of preparations of α-synucleins.
(A) SDS-PAGE electrophoresis and (B) native PAGE electrophoresis of wild type (Wt) and mutant (A53T, A30P and E46K) α-Syn preparations; (C) BN-PAGE of wild type (Wt) and mutant (A53T, A30P and E46K) α-Syn preparations; (D) α-Syn oligomer content after 20 hr incubation with cells (on a protomer basis), relative to the initial amount of exogenously added α-Syn, as determined by sandwich ELISA. (E) LDH release in mixed glial cultures following incubation for 20 hours with the highest concentration of α-Syn used in our experiments, i.e. 5 µg/ml. MG132, a proteasome inhibitor, was used at 6 µM as a control. Values are means from triplicate measurements.
Figure 2
Figure 2. Evaluation of the purity of isolated microglial cell fractions.
Immunofluorescence characterization of purified microglial cell cultures for the specific macroglial lineage marker GFAP (A), the pan haematopoietic lineage marker CD45 (B), and the mature macrophages markers CD11b (C), CD68 (D), and F4/80 (E). Nuclei are counterstained in blue with Hoechst 33342. Scale bar: 100 µm. mRNA expression (qRT-PCR) from isolated microglial preparations after no stimulation (control) or after stimulation with 1 µg/ml LPS for 20 hours (F). Specific primers for amplifying the GFAP and CD11b genes were used.
Figure 3
Figure 3. Pro-inflammatory interleukin profile of α-Syn-stimulated primary mixed glial and isolated microglial cultures.
IL-6 (A) and IL-1β (B) release was measured by ELISA in culture supernantants of mixed glia (left) and microglia (right) after a 20-hour treatment with monomeric Wt or mutant α-Syn variants or lipopolysaccharide (LPS). Values are mean ± S.E.M. (n = 4). * P<0.05, ** P<0.01, *** P<0.001. The results shown are representative of two or three independent experiments with microglia and mixed glial cultures, respectively.
Figure 4
Figure 4. Immunoregulatory effect of α-Syn-stimulation in primary mixed glial and isolated microglial cultures.
IL-10 release was measured by ELISA in supernatants of α-Syn-stimulated mixed-glial cultures (top) and microglia (bottom) after a 20-hour treatment with monomeric Wt or mutant α-Syn variants, or lipopolysaccharide (LPS). Values are mean ± S.E.M. (n = 4). * P<0.05, ** P<0.01, *** P<0.001. The results shown are representative of two or three independent experiments with microglia and mixed glial cultures, respectively.
Figure 5
Figure 5. Chemokine release profile of α-Syn-stimulated primary mixed glial cultures and isolated microglia cultures.
IP-10 (A), RANTES (B), MCP-1 (C), and MIP-1α (D) were measured in supernantants of mixed-glial cultures (left) and microglia (right) after a 20-hour treatment with monomeric Wt or mutant α-Syn variants, or lipopolysaccharide (LPS). All chemokines were assayed by ELISA as described in Materials and Methods. Values are mean ± S.E.M. (n = 2). * P<0.05, ** P<0.01. The results shown are representative of two and three independent experiments with microglia and mixed glial cultures, respectively.
Figure 6
Figure 6. Effect of α-Syn-stimulation on microglial phagocytosis.
(A) After treatment of the primary microglial cell cultures with α-Syn (1 µg/ml) for 20 hours, cells were incubated with fluorescent microspheres for 1 hour. After fixing the cells, phagocytosis was assessed by fluorescence microscopy analysis. The phagocytic index was calculated by dividing the fluorescence from the phagocytosed microspheres by the total number of cells in the images. Four images were analysed for each sample in each experiment, and the results shown are representative of three independent experiments. A.U.: arbitrary units. (Representative microscopy images used to determine the phagocityc activity of microglial cultures stimulated with Wt (top) an A30P (centre) α-Syn, or non stimulated microglial cells (bottom). From left to right, green fluorescent microspheres, Hoechst-stained cells, and cells as observed in the absence of fluorescence. Scale bar: 50 µM.

Similar articles

Cited by

References

    1. Spillantini MG, Crowther RA, Jakes R, Hasegawa M, Goedert M. alpha-Synuclein in filamentous inclusions of Lewy bodies from Parkinson's disease and dementia with Lewy bodies. Proc Natl Acad Sci USA. 1998;95:6469–6473. - PMC - PubMed
    1. Croisier E, Moran LB, Dexter DT, Pearce RK, Graeber MB. Microglial inflammation in the parkinsonian substantia nigra: relationship to alpha-synuclein deposition. J Neuroinflammation. 2005;2:14. - PMC - PubMed
    1. Eriksen JL, Wszolek Z, Petrucelli L. Molecular pathogenesis of Parkinson disease. Arch Neurol. 2005;62:353–357. - PubMed
    1. Moore DJ, West AB, Dawson VL, Dawson TM. Molecular pathophysiology of Parkinson's disease. Annu Rev Neurosci. 2005;28:57–87. - PubMed
    1. Chiti F, Dobson CM. Protein misfolding, functional amyloid, and human disease. Annu Rev Biochem. 2006;75:333–366. - PubMed

Publication types