

Transcriptional responses of Leptospira interrogans to host innate immunity: significant changes in metabolism, oxygen tolerance, and outer membrane
- PMID: 21049008
- PMCID: PMC2964297
- DOI: 10.1371/journal.pntd.0000857
Transcriptional responses of Leptospira interrogans to host innate immunity: significant changes in metabolism, oxygen tolerance, and outer membrane
Abstract
Background: Leptospira interrogans is the major causative agent of leptospirosis. Phagocytosis plays important roles in the innate immune responses to L. interrogans infection, and L. interrogans can evade the killing of phagocytes. However, little is known about the adaptation of L. interrogans during this process.
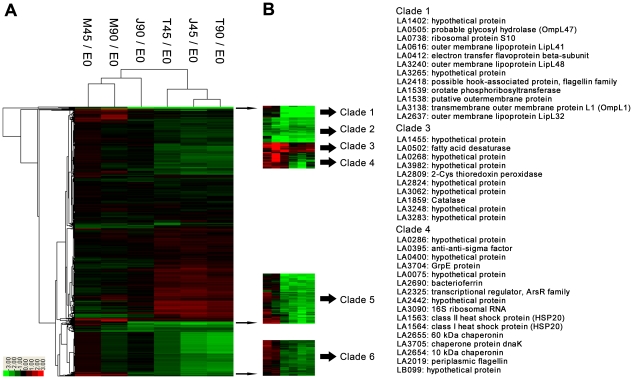
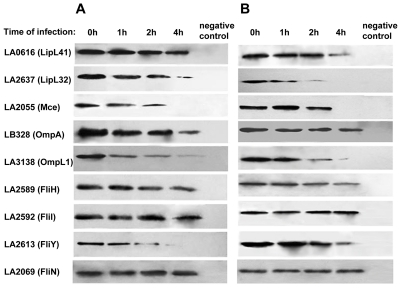
Methodology/principal findings: To better understand the interaction of pathogenic Leptospira and innate immunity, we employed microarray and comparative genomics analyzing the responses of L. interrogans to macrophage-derived cells. During this process, L. interrogans altered expressions of many genes involved in carbohydrate and lipid metabolism, energy production, signal transduction, transcription and translation, oxygen tolerance, and outer membrane proteins. Among them, the catalase gene expression was significantly up-regulated, suggesting it may contribute to resisting the oxidative pressure of the macrophages. The expressions of several major outer membrane protein (OMP) genes (e.g., ompL1, lipL32, lipL41, lipL48 and ompL47) were dramatically down-regulated (10-50 folds), consistent with previous observations that the major OMPs are differentially regulated in vivo. The persistent down-regulations of these major OMPs were validated by immunoblotting. Furthermore, to gain initial insight into the gene regulation mechanisms in L. interrogans, we re-defined the transcription factors (TFs) in the genome and identified the major OmpR TF gene (LB333) that is concurrently regulated with the major OMP genes, suggesting a potential role of LB333 in OMPs regulation.
Conclusions/significance: This is the first report on global responses of pathogenic Leptospira to innate immunity, which revealed that the down-regulation of the major OMPs may be an immune evasion strategy of L. interrogans, and a putative TF may be involved in governing these down-regulations. Alterations of the leptospiral OMPs up interaction with host antigen-presenting cells (APCs) provide critical information for selection of vaccine candidates. In addition, genome-wide annotation and comparative analysis of TFs set a foundation for further studying regulatory networks in Leptospira spp.
Conflict of interest statement
The authors have declared that no competing interests exist.
Figures


Similar articles
-
[Expression changes of major outer membrane protein antigens in Leptospira interrogans during infection and its mechanism].Zhejiang Da Xue Xue Bao Yi Xue Ban. 2013 Mar;42(2):156-63. doi: 10.3785/j.issn.1008-9292.2013.02.005. Zhejiang Da Xue Xue Bao Yi Xue Ban. 2013. PMID: 23585001 Chinese.
-
Global analysis of outer membrane proteins from Leptospira interrogans serovar Lai.Infect Immun. 2002 May;70(5):2311-8. doi: 10.1128/IAI.70.5.2311-2318.2002. Infect Immun. 2002. PMID: 11953365 Free PMC article.
-
Expression and comparative analysis of genes encoding outer membrane proteins LipL21, LipL32 and OmpL1 in epidemic leptospires.Acta Biochim Biophys Sin (Shanghai). 2005 Oct;37(10):649-56. doi: 10.1111/j.1745-7270.2005.00094.x. Acta Biochim Biophys Sin (Shanghai). 2005. PMID: 16215631
-
Technological advances in the molecular biology of Leptospira.J Mol Microbiol Biotechnol. 2000 Oct;2(4):455-62. J Mol Microbiol Biotechnol. 2000. PMID: 11075918 Review.
-
Sigma factors of RNA polymerase in the pathogenic spirochaete Leptospira interrogans, the causative agent of leptospirosis.FASEB J. 2023 Oct;37(10):e23163. doi: 10.1096/fj.202300252RRR. FASEB J. 2023. PMID: 37688587 Review.
Cited by
-
Heterologous Expression, Purification and Characterization of an Oligopeptidase A from the Pathogen Leptospira interrogans.Mol Biotechnol. 2018 Apr;60(4):302-309. doi: 10.1007/s12033-018-0073-8. Mol Biotechnol. 2018. PMID: 29502205
-
Gene expression profiles of immune mediators and histopathological findings in animal models of leptospirosis: comparison between susceptible hamsters and resistant mice.Infect Immun. 2011 Nov;79(11):4480-92. doi: 10.1128/IAI.05727-11. Epub 2011 Aug 15. Infect Immun. 2011. PMID: 21844232 Free PMC article.
-
Haemophilus ducreyi Hfq contributes to virulence gene regulation as cells enter stationary phase.mBio. 2014 Feb 11;5(1):e01081-13. doi: 10.1128/mBio.01081-13. mBio. 2014. PMID: 24520065 Free PMC article.
-
Characterization of the microtranscriptome of macrophages infected with virulent, attenuated and saprophyte strains of Leptospira spp.PLoS Negl Trop Dis. 2018 Jul 6;12(7):e0006621. doi: 10.1371/journal.pntd.0006621. eCollection 2018 Jul. PLoS Negl Trop Dis. 2018. PMID: 29979677 Free PMC article.
-
Evidence for a Putative Regulatory System Consisting of an ECF σE-Type Factor, LIC_12757, and a FecR-like σ Factor Regulator, LIC_12756, in the Pathogenic Spirochaetes Leptospira interrogans.Int J Mol Sci. 2025 May 22;26(11):4994. doi: 10.3390/ijms26114994. Int J Mol Sci. 2025. PMID: 40507805 Free PMC article.
References
-
- Bharti AR, Nally JE, Ricaldi JN, Matthias MA, Diaz MM, et al. Leptospirosis: a zoonotic disease of global importance. Lancet Infect Dis. 2003;3:757–771. - PubMed
-
- Ren SX, Fu G, Jiang XG, Zeng R, Miao YG, et al. Unique physiological and pathogenic features of Leptospira interrogans revealed by whole-genome sequencing. Nature. 2003;422:888–893. - PubMed
Publication types
MeSH terms
Substances
LinkOut - more resources
Full Text Sources
Miscellaneous
