. 2010 Oct 26;5(10):e13615.
doi: 10.1371/journal.pone.0013615.

Functional genomics of 5- to 8-cell stage human embryos by blastomere single-cell cDNA analysis

Affiliations

Functional genomics of 5- to 8-cell stage human embryos by blastomere single-cell cDNA analysis

Amparo Galán et al. PLoS One. .

Abstract

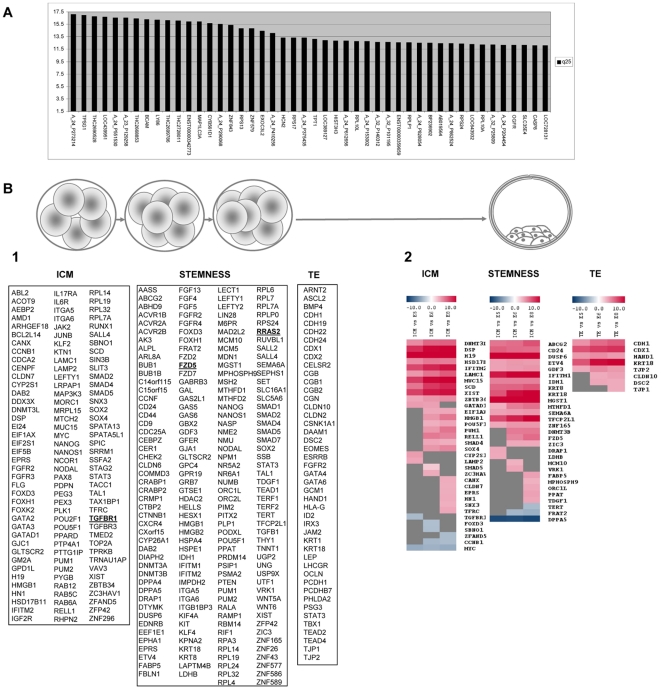
Blastomere fate and embryonic genome activation (EGA) during human embryonic development are unsolved areas of high scientific and clinical interest. Forty-nine blastomeres from 5- to 8-cell human embryos have been investigated following an efficient single-cell cDNA amplification protocol to provide a template for high-density microarray analysis. The previously described markers, characteristic of Inner Cell Mass (ICM) (n = 120), stemness (n = 190) and Trophectoderm (TE) (n = 45), were analyzed, and a housekeeping pattern of 46 genes was established. All the human blastomeres from the 5- to 8-cell stage embryo displayed a common gene expression pattern corresponding to ICM markers (e.g., DDX3, FOXD3, LEFTY1, MYC, NANOG, POU5F1), stemness (e.g., POU5F1, DNMT3B, GABRB3, SOX2, ZFP42, TERT), and TE markers (e.g., GATA6, EOMES, CDX2, LHCGR). The EGA profile was also investigated between the 5-6- and 8-cell stage embryos, and compared to the blastocyst stage. Known genes (n = 92) such as depleted maternal transcripts (e.g., CCNA1, CCNB1, DPPA2) and embryo-specific activation (e.g., POU5F1, CDH1, DPPA4), as well as novel genes, were confirmed. In summary, the global single-cell cDNA amplification microarray analysis of the 5- to 8-cell stage human embryos reveals that blastomere fate is not committed to ICM or TE. Finally, new EGA features in human embryogenesis are presented.


Conflict of interest statement

Competing Interests: The authors have declared that no competing interests exist.

Figures

Figure 1
Figure 1. Experimental design.
(A) Blastomere biopsy and ICM and TE isolation procedures. (B) Schematic representation of the experimental design. A total of 55 biopsied single blastomeres, 2 ICM and 2 TE were cDNA amplified and in vitro transcribed for microarray analysis. The signal quality in the microarrays hybridized to biological samples was compared to that of the negative control, and 6 samples were finally discarded. The normalized data from the 5-, 6- and 8-cell embryos single blastomeres microarrays were compared to each other and with ICM and TE to check for the gene expression related with ICM, stemness, TE and the EGA signature.
Figure 2
Figure 2. Gene expression analysis and blastomere fate.
(A) List of the putative housekeeping genes common for blastomeres, and the ICM and TE cells from the blastocysts. Those genes with higher values and a low standard deviation (sd iqr <1) (values corresponding to quantile 25 with a sd iqr less than 1) were chosen as putative housekeeping genes (X axis). The maximum data score value in the microarray is 17.5 and 1.63 the minimum (Y axis). (B) Comparative analysis of ICM, stemness and TE gene markers in the single blastomeres from the 5-, 6- and 8- cell embryos (1) were compared to the ICM and TE differentiated cells (2). (1) No statistical difference (p value<0.05) was found for most markers except for RRAS2, FZD5 and TGFBR1 (underlined and in bold), which were up-regulated in 5-cell embryo blastomeres compared to the 6-cell (RRAS2), 8-cell (FZD5), and to both of them (TGFBR1). (2) Heat map representation of the significant differential expression (p value<0.05) between the 5- and 8- single blastomeres with ICM and TE. Gray indicates no significant differences. Red means an overexpression in the ICM or TE samples, and blue depicts an over-representation in the single blastomere samples. The color code of the expression level is indicated at the top of the figure. The complete data can be checked in Supplementary Table S2.
Figure 3
Figure 3. Genes involved in embryonic genome activation (EGA).
EGA entails maternal degradation from the genes existing in the blastomeres (shown in blue) and the gene activation of the transcription factors of the embryo genome (shown in red). (A) The novel gene markers involved in putative maternal degradation or genome activation in the 5- to 8- cell embryo blastomeres have been grouped into clusters according to their gene expression profile. (B) List of markers showing an intermediate pattern in the 5- to 8- cell embryo blastomeres, including maternal degradation at the 6-cell and slight activation later, gene activation at the 6-cell stage and slight subsequent down-regulation and a significant overexpression in the 8-cell stage versus the 6-cell-stage blastomeres. (C) Definitive analysis of EGA involving the 5- to 8- cell embryos compared to blastocysts. Gene expression profiles confirm previously reported results. Only those genes with statistically significant differences (p value<0.05) have been considered for the analysis. The complete data can be checked in Supplemental Table S3 and Supplemental Figure S1.
Figure 4
Figure 4. Gene expression validation of the microarray data by qPCR.
(A) Gene expression analysis was analysed in non amplified and amplified samples in 5-, 6- and 8-cell embryo blastomeres with CCT3 primers, blastomeres and ICM (HMGB1, IFITM2), blastomeres and TE (CDX1, HAND1), blastomeres, ICM and TE (KRT18), blastomeres, ICM and blastocysts (DPPA5, MYC, POU5F1), and blastomeres, TE and blastocysts (CDH1). RPS24 was used as the reference gene in all cases. Results were compared with microarray data to check ICM, stemness, TE and EGA signatures. (B) Cp values of the selected housekeeping genes in non amplified and amplified blastomeres, ICM and TE samples and their microarray counterparts. (C) Gene list description for each category validation. Color legends used in the graphics is specified at the top right of the Figure.

Similar articles

Cited by

References

    1. Adjaye J, Huntriss J, Herwig R, BenKahla A, Brink TC, et al. Primary differentiation in the human blastocyst: comparative molecular portraits of inner cell mass and trophectoderm cells. Stem Cells. 2005;23:1514–1525. - PubMed
    1. Cauffman G, De Rycke M, Sermon K, Liebaers I, Van de Velde H. Markers that define stemness in ESC are unable to identify the totipotent cells in human preimplantation embryos. Hum Reprod. 2009;24:63–70. - PubMed
    1. Braude P, Bolton V, Moore S. Human gene expression first occurs between the four- and eight-cell stages of preimplantation development. Nature. 1988;332:459–461. - PubMed
    1. Bischoff M, Parfitt DE, Zernicka-Goetz M. Formation of the embryonic-abembryonic axis of the mouse blastocyst: relationships between orientation of early cleavage divisions and pattern of symmetric/asymmetric divisions. Development. 2008;135:953–962. - PMC - PubMed
    1. Gardner RL. The early blastocyst is bilaterally symmetrical and its axis of symmetry is aligned with the animal-vegetal axis of the zygote in the mouse. Development. 1997;124:289–301. - PubMed

Publication types

Substances