. 2010 Oct 26;5(10):e13645.
doi: 10.1371/journal.pone.0013645.

Hearing it again and again: on-line subcortical plasticity in humans

Affiliations

Hearing it again and again: on-line subcortical plasticity in humans

Erika Skoe et al. PLoS One. .

Abstract

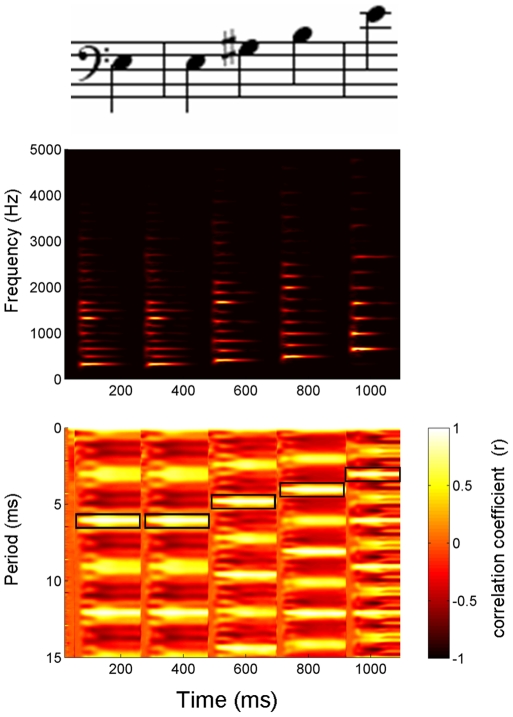
Background: Human brainstem activity is sensitive to local sound statistics, as reflected in an enhanced response in repetitive compared to pseudo-random stimulus conditions [1]. Here we probed the short-term time course of this enhancement using a paradigm that assessed how the local sound statistics (i.e., repetition within a five-note melody) interact with more global statistics (i.e., repetition of the melody).

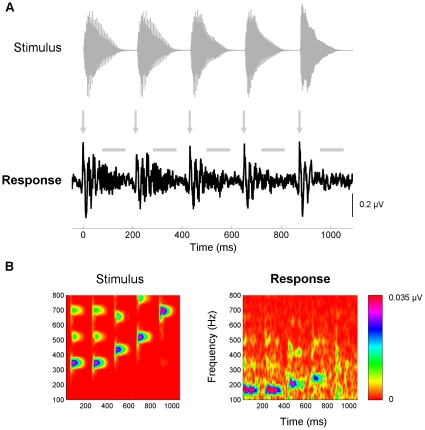
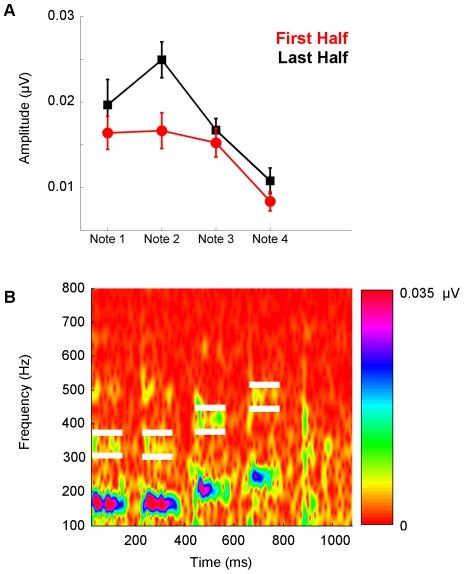
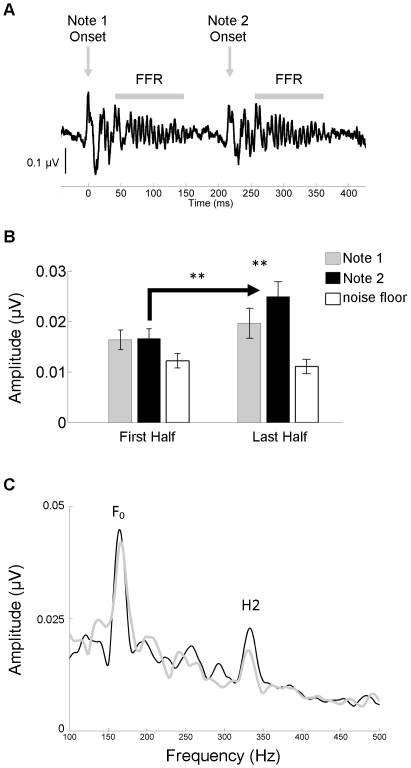
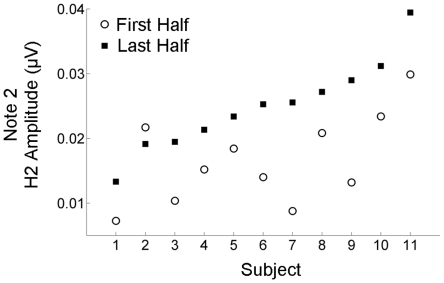
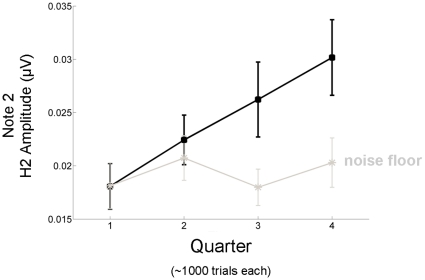
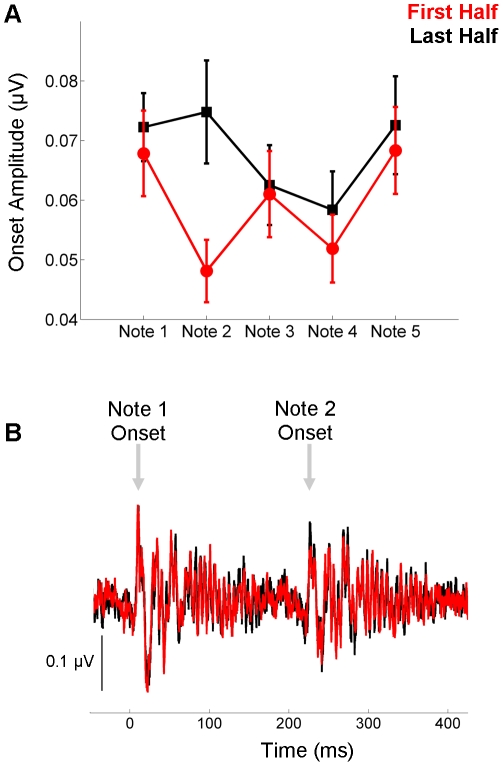
Methodology/principal findings: To test the hypothesis that subcortical repetition enhancement builds over time, we recorded auditory brainstem responses in young adults to a five-note melody containing a repeated note, and monitored how the response changed over the course of 1.5 hrs. By comparing response amplitudes over time, we found a robust time-dependent enhancement to the locally repeating note that was superimposed on a weaker enhancement of the globally repeating pattern.

Conclusions/significance: We provide the first demonstration of on-line subcortical plasticity in humans. This complements previous findings that experience-dependent subcortical plasticity can occur on a number of time scales, including life-long experiences with music and language, and short-term auditory training. Our results suggest that the incoming stimulus stream is constantly being monitored, even when the stimulus is physically invariant and attention is directed elsewhere, to augment the neural response to the most statistically salient features of the ongoing stimulus stream. These real-time transformations, which may subserve humans' strong disposition for grouping auditory objects, likely reflect a mix of local processes and corticofugal modulation arising from statistical regularities and the influences of expectation. Our results contribute to our understanding of the biological basis of statistical learning and initiate a new investigational approach relating to the time-course of subcortical plasticity. Although the reported time-dependent enhancements are believed to reflect universal neurophysiological processes, future experiments utilizing a larger array of stimuli are needed to establish the generalizability of our findings.


Conflict of interest statement

Competing Interests: The authors have declared that no competing interests exist.

Figures

Figure 1
Figure 1. Description of the stimulus.
(Top) The melody was composed of piano five notes, E3-E3-G#3-B3-E4. Notes 1 and 2 were acoustically identical. (Middle) Each ∼220 ms note had a rich harmonic structure that was dominated by the second harmonic (H2) (330, 330, 416, 494, 660 Hz, respectively), the lowest frequency in the spectrum of this “missing fundamental” stimulus. (Bottom) As shown in the stimulus autocorrelogram, the amplitudes of the harmonics interact to create a signal that is strongly modulated at the period of the fundamental frequency (F0), as evidenced by the brightest bands of color occurring at periods of 6.06, 6.06, 4.81, 4.05, 3.03 ms, respectively (marked by black boxes). The reciprocal of these periods correspond to 165, 165, 208, 247, 330 Hz, respectively. Following procedures described in Kraus and Skoe (2010) , the autocorrelogram was generated using a sliding-window cross-correlation function. The first time window encapsulated 0–40 ms of the stimulus, with each subsequent window starting 1 ms after the previous. Each 40-ms time window was cross-correlated with itself and degree of correlation at each time shift (y-axis) is plotted using a color scale, such that white represents the highest correlation. In this plot, the x-axis values refer to the center of each window (e.g., window 1 at 20 ms, window 2 at 21 ms, etc.) and the y-axis values refer to the time shift of the autocorrelation function.
Figure 2
Figure 2. Description of the response.
(A) Time domain. Percussive instruments, like the piano, have sharp attacks and rapid decays. As seen here, these aspects of the stimulus (top, gray) are preserved in the response (bottom, black). This is evidenced by large response peaks coinciding with the onset of each piano note (arrows). Horizontal bars identify the frequency-following response (FFR), the neural synchronization to the periodic aspects of each note. (B) Frequency domain. The stimulus (left) and response (right) spectrograms. Phase-locking to the fundamental (F0) and its second harmonic (H2) is observed in the FFR to each note. As predicted from the low-pass nature of brainstem phase-locking, the response to the F0 (165, 165, 208, 247, 330 Hz, respectively) is stronger than the response to resolved harmonics of the stimulus (H2 = 330, 330, 416, 494, 660 Hz, respectively). A representative subject is plotted.
Figure 3
Figure 3. Repetition enhancement of the melody.
(A) Across all notes, the frequency-following response to the second harmonic (H2) was larger during the second half of the recording session (red) compared to the first half (black). (B) White boxes bracket H2 for Notes 1–4 in the response spectrogram of a representative subject (averaged across all trials).
Figure 4
Figure 4. Local repetition enhancement over time.
(A) The onset and frequency-following responses (FFRs) are plotted here in the time domain for Notes 1 and 2. In the stimulus, Notes 1 and 2 are identical in all respects. (B) The FFRs to Notes 1 and 2 did not differ in terms of the amplitude of second harmonic (H2) during the first half of the recording (left), but they did differ during the second half (right). While both Notes increased in amplitude over the recording session, the Note 2 enhancement was most pronounced (an average of 21.34% and 64.80% increase, respectively). This enhancement was not the result of increased activity in the noise floor (white bars represent the noise floor for Note 2 during the first and last halves). (C) The grand average spectrum for the last half of the recording is plotted for Notes 1 (gray) and 2 (black). The spectral peaks corresponding to the fundamental frequency (F0) and H2 are labeled.
Figure 5
Figure 5. Time-dependent local enhancement of Note 2 in individual participants.
For the frequency-following response to Note 2, the second harmonic (H2) amplitude is plotted for the first (open circles) and last (black squares) halves of the recording. The H2 enhancement, which ranged from 21.1–65.5%, was observed in 91% of the participants (10/11).
Figure 6
Figure 6. Local repetition enhancement of the frequency-following response (FFR) evolves throughout the test session.
For Note 2 (black squares) the amplitude of the second harmonic (H2) increases monotonically over the test session. Each point represents the H2 amplitude derived from an average of ∼1000 trials. This increase in the FFR did not result from concomitant changes in the noise floor (gray stars).
Figure 7
Figure 7. Repetition effects for the onset response.
(A) For all notes, the onset response was larger during the second half of the recording session (red) compared to the first half (black). (B) As shown here in the time domain waveforms, the onset response to Note 2 is markedly bigger during the second half of the recording compared to the first.

Similar articles

Cited by

References

    1. Chandrasekaran B, Hornickel J, Skoe E, Nicol T, Kraus N. Context-dependent encoding in the human auditory brainstem relates to hearing speech in noise: implications for developmental dyslexia. Neuron. 2009;64:311–319. - PMC - PubMed
    1. Large E, Jones M. The dynamics of attending: How people track time-varying events. Psychol Rev. 1999;106:119–159.
    1. Saffran JR. Musical learning and language development. Ann N Y Acad Sci. 2003;999:397–401. - PubMed
    1. Winkler I, Denham SL, Nelken I. Modeling the auditory scene: predictive regularity representations and perceptual objects. Trends Cogn Sci. 2009;13:532–540. - PubMed
    1. Drake C, Bertrand D. The quest for universals in temporal processing in music. Ann N Y Acad Sci. 2001;930:17–27. - PubMed

Publication types