. 2010 Oct 25;5(10):e13589.
doi: 10.1371/journal.pone.0013589.

Specified species in gingival crevicular fluid predict bacterial diversity

Affiliations

Specified species in gingival crevicular fluid predict bacterial diversity

Sirkka Asikainen et al. PLoS One. .

Abstract

Background: Analysis of gingival crevicular fluid (GCF) samples may give information of unattached (planktonic) subgingival bacteria. Our study represents the first one targeting the identity of bacteria in GCF.

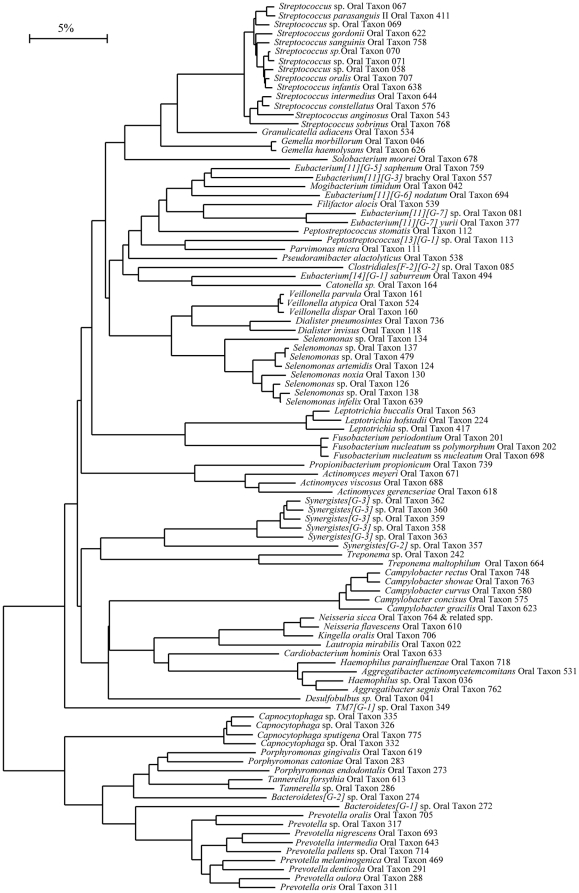
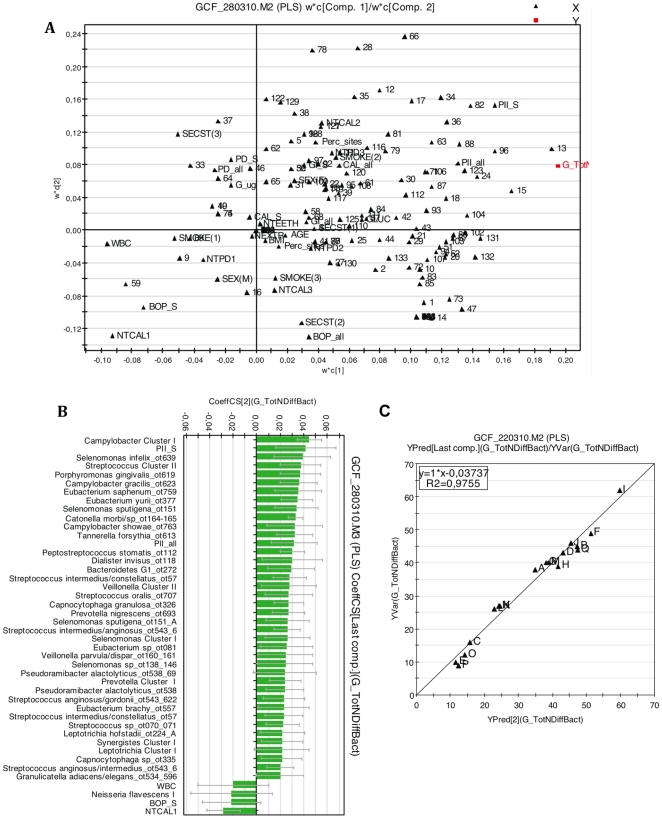
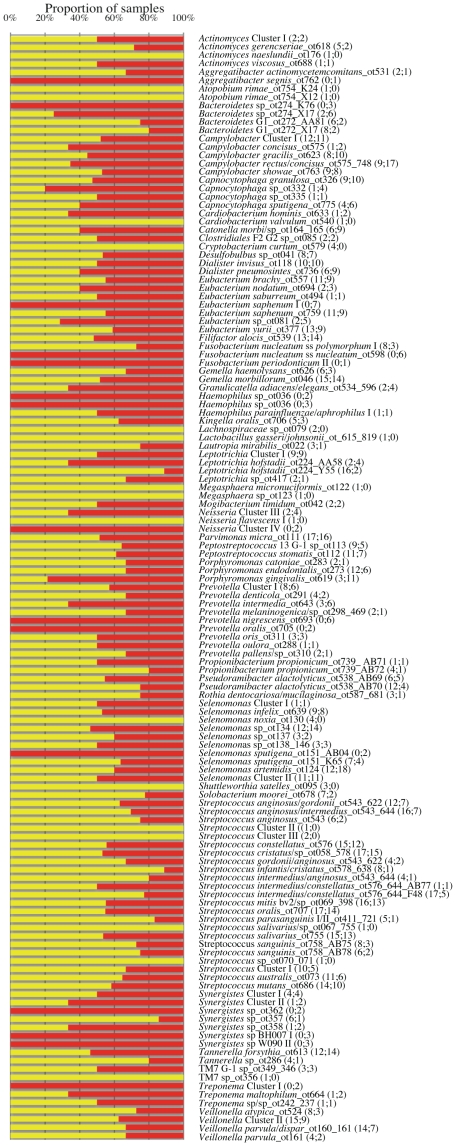
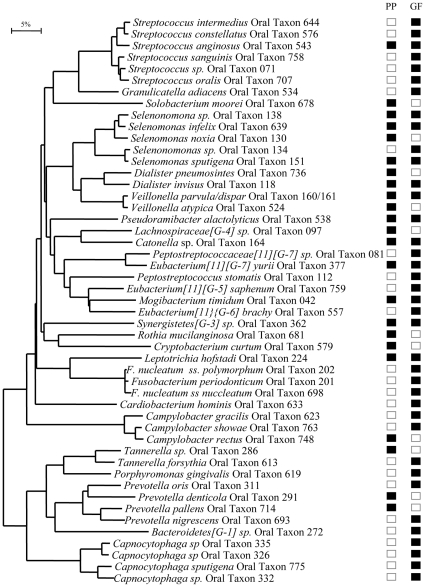
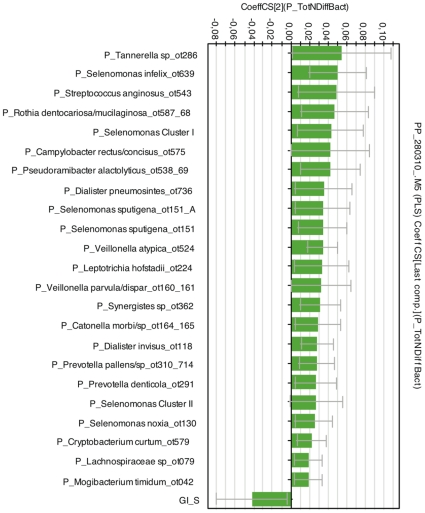
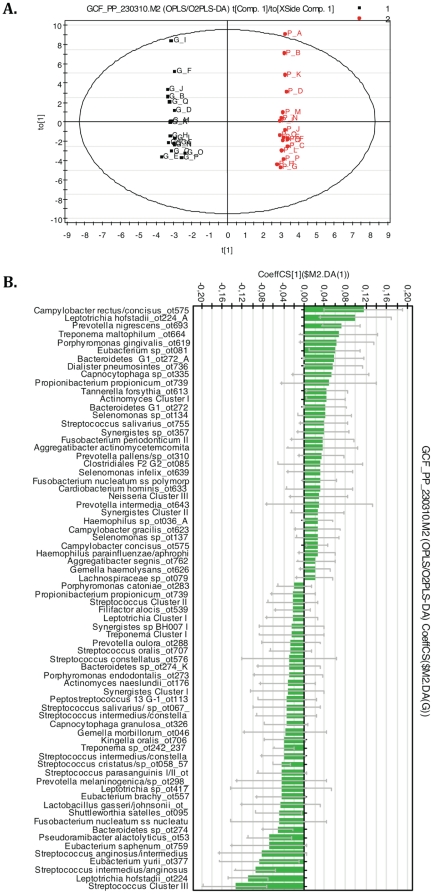
Methodology/principal findings: We determined bacterial species diversity in GCF samples of a group of periodontitis patients and delineated contributing bacterial and host-associated factors. Subgingival paper point (PP) samples from the same sites were taken for comparison. After DNA extraction, 16S rRNA genes were PCR amplified and DNA-DNA hybridization was performed using a microarray for over 300 bacterial species or groups. Altogether 133 species from 41 genera and 8 phyla were detected with 9 to 62 and 18 to 64 species in GCF and PP samples, respectively, per patient. Projection to latent structures by means of partial least squares (PLS) was applied to the multivariate data analysis. PLS regression analysis showed that species of genera including Campylobacter, Selenomonas, Porphyromonas, Catonella, Tannerella, Dialister, Peptostreptococcus, Streptococcus and Eubacterium had significant positive correlations and the number of teeth with low-grade attachment loss a significant negative correlation to species diversity in GCF samples. OPLS/O2PLS discriminant analysis revealed significant positive correlations to GCF sample group membership for species of genera Campylobacter, Leptotrichia, Prevotella, Dialister, Tannerella, Haemophilus, Fusobacterium, Eubacterium, and Actinomyces.

Conclusions/significance: Among a variety of detected species those traditionally classified as Gram-negative anaerobes growing in mature subgingival biofilms were the main predictors for species diversity in GCF samples as well as responsible for distinguishing GCF samples from PP samples. GCF bacteria may provide new prospects for studying dynamic properties of subgingival biofilms.


Conflict of interest statement

Competing Interests: The authors have declared that no competing interests exist.

Figures

Figure 1
Figure 1. Phylogenetic tree of the bacterial species/phylotypes identified in DNA microarray analysis of GCF samples.
The marker bar represents 5% difference in nucleotide sequences. GCF: gingival crevicular fluid.
Figure 2
Figure 2. Interrelations between bacterial and host-associated variables and correlation to bacterial species/phylotype diversity in GCF samples.
A multivariate PLS modeling was used for data analysis. Loading scatter plot (Panel A) displays the correlation structure of the variables (X variables: N = 166; Y variable: Number of different bacterial species/phylotypes in GCF samples). A number code was given for each bacterial taxon in their alphabetical order (Panel A) (the key is shown in online Supporting information Table S1). PLS regression coefficient plot (Panel B) identified X variables with statistically significant correlation to Y. The coefficients (>0.02 or <−0.02 are shown) are statistically significant when the error bars do not cross the 0 line. The model explained 98% and, according to cross validation, predicted 79% of the variation in Y. Observed values vs. predicted values R2 = 0.975 (Panel C). Capital letters are patient identifiers (Panel C). X variables were scaled and centered and Y variable scaled. The confidence intervals were derived from jack knifing. GCF: gingival crevicular fluid.
Figure 3
Figure 3. Distribution pattern for species/phylotypes in GCF samples and subgingival PP samples.
The bars show proportion of GCF and PP samples of all samples testing positive for the depicted species/phylotypes. The numbers in parentheses after species definitions show the number of positive samples in both types of samples (PP;GCF). Yellow bars PP samples, red bars GCF samples. PP: paper point; GCF: gingival crevicular fluid.
Figure 4
Figure 4. Phylogenetic analysis of bacterial species/phylotypes contributing to species/phylotype diversity in GCF samples and PP samples.
The species/phylotypes with statistically significant PLS regression coefficients >0.02 or <−0.02 (data from Figure 2B for the GCF samples and from Figure 5 for the PP samples) were selected for the phylogenetic analysis. The marker bar represents 5% difference in nucleotide sequences. GF abbreviation for gingival crevicular fluid and PP for subgingival paper point samples. Black boxes indicate presence and white boxes absence of the depicted species/phylotype.
Figure 5
Figure 5. Contribution of bacterial and host-associated variables to bacterial species/phylotype diversity in subgingival PP samples.
PLS regression coefficient plot identified X variables with statistically significant correlation to Y (Y  =  number of different bacterial species/phylotypes in PP samples). Among them those with coefficients >0.02 or <−0.02 are shown and bacterial species/phylotypes were subjected to phylogenetic analysis presented in Figure 4. The PLS model included 166 X variables. The model explained 98% and, according to cross validation, predicted 52% of the variation in Y. X variables were scaled and centered and Y variable scaled. The confidence intervals were derived from jack knifing. The coefficients are statistically significant when the error bars do not cross the 0 line. GCF: gingival crevicular fluid; PP: paper point.
Figure 6
Figure 6. Bacterial species/phylotypes responsible for the difference in bacterial composition between GCF samples and PP samples.
Multivariate OPLS/2OPLS-DA model was generated for 2 classes. The score plot (Panel A) demonstrates the relationship between the 2 types of samples and between the patients. Capital letters are patient identifiers, “G” (black color) for GCF samples and “P” (red color) for PP samples. The X variables included 133 species/phylotypes identified by DNA microarray. The binary Y variable defines the group membership to GCF or PP samples. Ellipse: Hotelling T2 (0.95). PLS regression analysis (Panel B) indicated the extent each variable positively or negatively contributed to GCF sample membership and vice versa to PP sample membership. The coefficients are statistically significant when the error bars do not cross the 0 line. The model explained 99% of the variation of Y and, according to cross validation, predicted 70% of the variation of Y. X variables were scaled and centered and Y variables scaled. The confidence intervals (95%) were derived from jack knifing. GCF: gingival crevicular fluid; PP: paper point.

Similar articles

Cited by

References

    1. Baelum V, van Palenstein Helderman W, Hugoson A, Yee R, Fejerskov O. A global perspective on changes in the burden of caries and periodontitis: implications for dentistry. J Oral Rehabil. 2007;34:872–906; discussion 940. - PubMed
    1. Loos BG. Systemic markers of inflammation in periodontitis. J Periodontol. 2005;76:2106–2115. - PubMed
    1. Libby P. Inflammation in atherosclerosis. Nature. 2002;420:868–874. - PubMed
    1. Ridker PM, Silvertown JD. Inflammation, C-reactive protein, and atherothrombosis. J Periodontol. 2008;79:1544–1551. - PubMed
    1. Karched M, Ihalin R, Eneslatt K, Zhong D, Oscarsson J, et al. Vesicle-independent extracellular release of a proinflammatory outer membrane lipoprotein in free-soluble form. BMC Microbiol. 2008;8:18. - PMC - PubMed

Publication types

Substances

Associated data