. 2010 Oct 19;8(10):e1000514.
doi: 10.1371/journal.pbio.1000514.

Quiescent fibroblasts exhibit high metabolic activity

Affiliations

Quiescent fibroblasts exhibit high metabolic activity

Johanna M S Lemons et al. PLoS Biol. .

Abstract

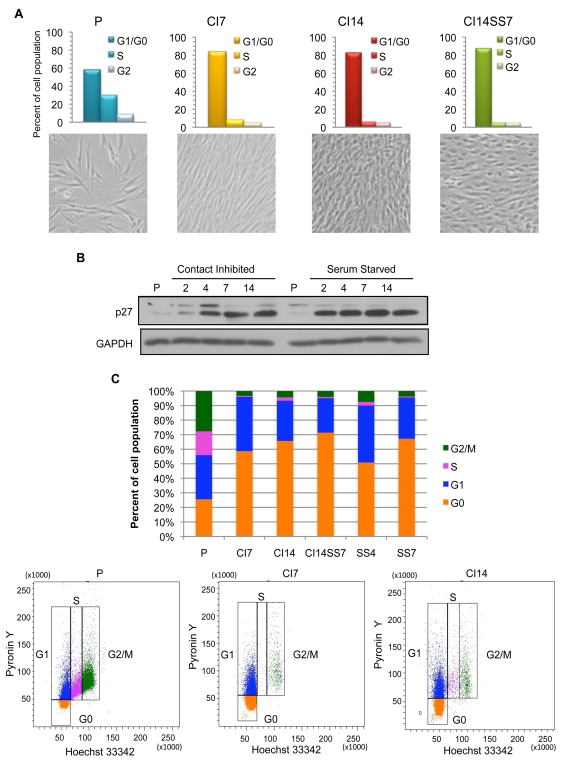
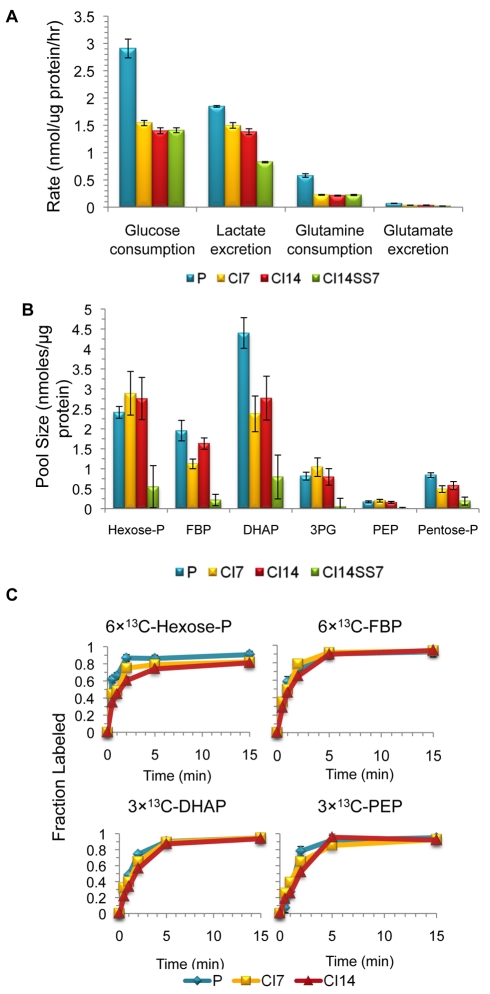
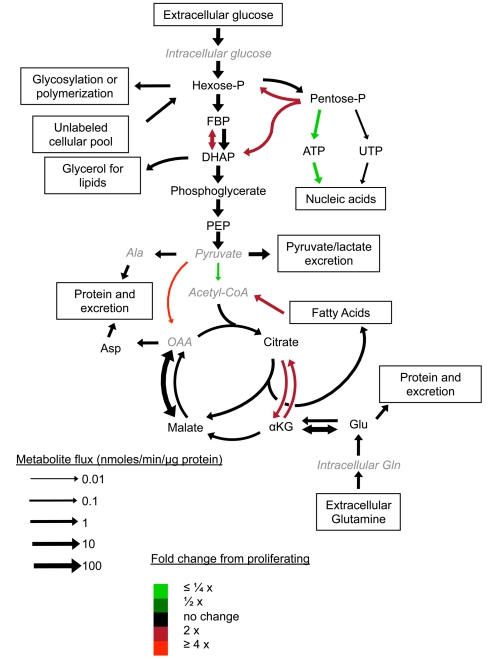
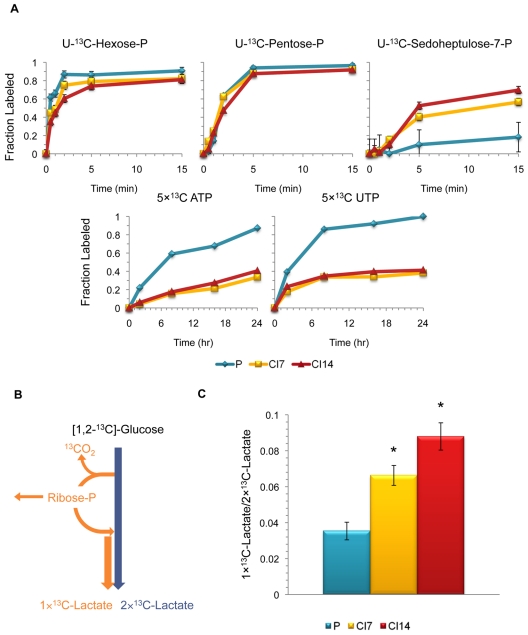
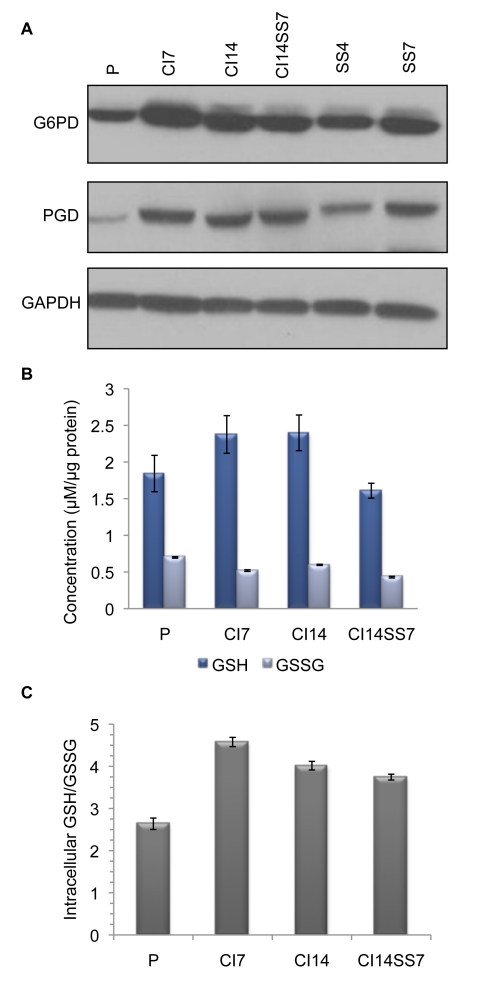
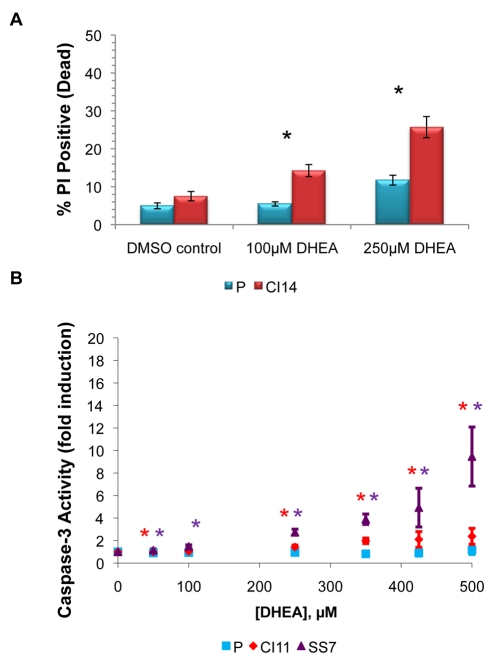
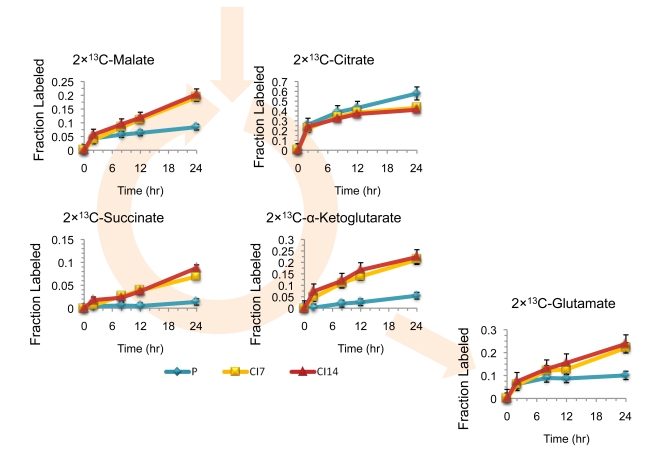
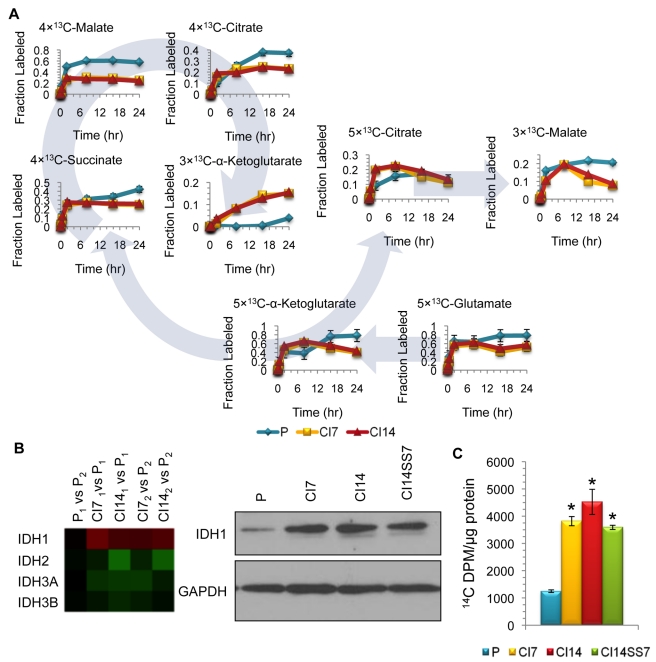
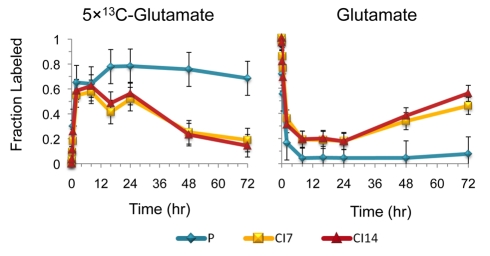
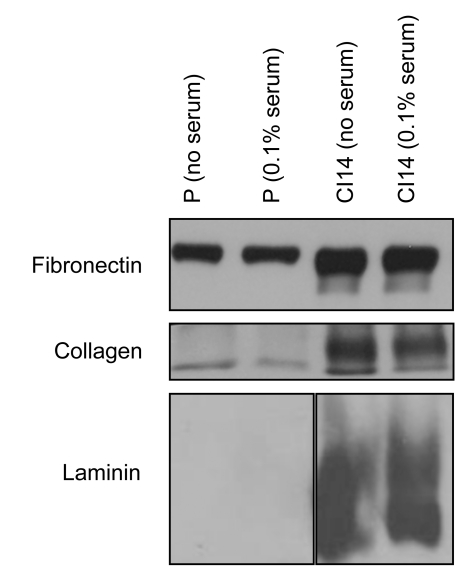
Many cells in mammals exist in the state of quiescence, which is characterized by reversible exit from the cell cycle. Quiescent cells are widely reported to exhibit reduced size, nucleotide synthesis, and metabolic activity. Much lower glycolytic rates have been reported in quiescent compared with proliferating lymphocytes. In contrast, we show here that primary human fibroblasts continue to exhibit high metabolic rates when induced into quiescence via contact inhibition. By monitoring isotope labeling through metabolic pathways and quantitatively identifying fluxes from the data, we show that contact-inhibited fibroblasts utilize glucose in all branches of central carbon metabolism at rates similar to those of proliferating cells, with greater overflow flux from the pentose phosphate pathway back to glycolysis. Inhibition of the pentose phosphate pathway resulted in apoptosis preferentially in quiescent fibroblasts. By feeding the cells labeled glutamine, we also detected a "backwards" flux in the tricarboxylic acid cycle from α-ketoglutarate to citrate that was enhanced in contact-inhibited fibroblasts; this flux likely contributes to shuttling of NADPH from the mitochondrion to cytosol for redox defense or fatty acid synthesis. The high metabolic activity of the fibroblasts was directed in part toward breakdown and resynthesis of protein and lipid, and in part toward excretion of extracellular matrix proteins. Thus, reduced metabolic activity is not a hallmark of the quiescent state. Quiescent fibroblasts, relieved of the biosynthetic requirements associated with generating progeny, direct their metabolic activity to preservation of self integrity and alternative functions beneficial to the organism as a whole.


Conflict of interest statement

The authors have declared that no competing interests exist.

Figures

Figure 1
Figure 1. Model system of proliferating and quiescent fibroblasts.
(A) Proliferating (P), CI7, CI14, and CI14SS7 fibroblasts were stained with PI and analyzed for cell cycle distribution with flow cytometry. The fraction of cells in G0/G1 increased in quiescent cells. Images of cells in different proliferative states are shown below. (B) Lysates from fibroblasts induced into quiescence by contact inhibition or serum starvation were collected over a time course and analyzed by immunoblotting with an antibody to p27Kip1. p27Kip1 levels were induced in cells made quiescent by either antiproliferative signal. (C) Proliferating and quiescent fibroblasts were stained with pyronin Y and Hoechst 33342 and analyzed by flow cytometry (lower panels). The fraction of cells with low pyronin Y content increased in fibroblasts induced into quiescence by multiple methods (upper panel).
Figure 2
Figure 2. Glycolytic rates are similar in proliferating and quiescent fibroblasts.
(A) The amount of glucose, lactate, glutamine, and glutamate were measured in conditioned medium from proliferating (P), CI7, CI14, and CI14SS7 cells. Data are from three experiments with five replicates at each time point, and error bars indicate standard error. (B) Metabolites were extracted from cells in different proliferative states, and the levels of specific metabolites were quantified using mass spectrometry. Metabolite levels in individual samples were normalized to protein content at the time of harvest. Means from four experiments, each containing 4–5 replicates, are shown. Error bars indicate standard error. With a false discovery rate of 0.05, none of the metabolite levels are different between the proliferating, CI7, and CI14 cells. (C) Isotope labeling dynamics of glycolysis in proliferating, CI7, and CI14 fibroblasts. Medium was changed to [U-13C]-glucose at time zero, and the fraction of each metabolite that is 13C-labeled was determined at the indicated times after switching to labeled medium. Data are pooled from five experiments, and error bars indicate standard deviations. 3PG, 3-phosphoglycerate; Hexose-P, hexose phosphate; Pentose-P, pentose phosphate; PEP, phosphoenolpyruvate.
Figure 3
Figure 3. Comparison of central metabolic fluxes in proliferating and CI14 fibroblasts.
Fluxes were derived by computational integration of all available experimental data within a systems-level, flux-balanced metabolic model. Arrow size indicates the magnitude of the flux in CI14 fibroblasts. Color indicates relative rates compared to proliferating fibroblasts; red indicates higher flux in CI14 fibroblasts and green indicates higher flux in proliferating fibroblasts. While the ribose phosphate–to-UTP flux is mostly faster (within the 1,000 identified solutions) for proliferating than quiescent fibroblasts, its distributions do overlap across different proliferative states, so our stringent condition for different rates is not met in this particular case (see Materials and Methods). αKG, α-ketoglutarate; Hexose-P, hexose phosphate; OAA, oxaloacetate; Pentose-P, pentose phosphate; PEP, phosphoenolpyruvate.
Figure 4
Figure 4. The PPP is active in quiescent fibroblasts.
(A) Isotope labeling dynamics in the PPP for proliferating (P), CI7, and CI14 fibroblasts. The fraction of fully labeled hexose phosphate, pentose phosphate, or sedoheptulose-7-phosphate after addition of [U-13C]-glucose is plotted for cells in each condition at each time point. Similarly, the fraction of ATP and UTP with five 13C atoms is plotted. The 5×13C-ATP and 5×13C-UTP are uniformly labeled in their ribose portion and unlabeled in the base portion, as confirmed by tandem mass spectrometry analysis. Data are pooled from five experiments, and error bars indicate standard deviation. -P, phosphate. (B) Schematic diagram of lactate labeling from [1, 2-13C]-glucose. [1, 2-13C]-glucose is converted into 2×13C-lactate through the canonical glycolysis pathway and 1×13C-lactate through the PPP. (C) Fibroblasts in different proliferative conditions were incubated with [1, 2-13C]-glucose for 4 h. Levels of 1×13C-lactate and 2×13C-lactate were monitored with mass spectrometry. The ratio of 1×13C-lactate to 2×13C-lactate is plotted for fibroblasts in each condition. Means ± one standard error (n = 4) are shown. Asterisks indicate p-value<0.01 (proliferating versus CI7, p = 0.006, and proliferating versus CI14 fibroblasts p = 0.002 by Student's t test).
Figure 5
Figure 5. PPP enzymes are induced and the fraction of GSH is enhanced in quiescent fibroblasts.
(A) Protein levels of G6PD and PGD, both of which generate NADPH, were monitored in proliferating (P) and quiescent fibroblasts by immunoblotting. GAPDH was monitored as a loading control. (B) Total GSH and GSSG content of proliferating, CI7, CI14, and CI14SS7. Data represent one experiment performed in duplicate, and error bars indicate standard deviation. (C) The ratio of GSH to GSSG was calculated using the data from (B).
Figure 6
Figure 6. The PPP contributes to the survival of quiescent fibroblasts.
(A) Proliferating (P) or CI14 fibroblasts were treated with DMSO control, 100 µM DHEA, or 250 µM DHEA for 4 d. Cells were incubated with PI and analyzed by flow cytometry. Data are from four independent experiments; error bars indicate standard error. For CI14 versus proliferating with no treatment, p = 0.113. For CI14 versus proliferating with 100 µM DHEA, p = 0.0012. For CI14 versus proliferating with 250 µM DHEA, p = 0.0011. Asterisks indicate statistical significance of p<0.01. (B) Proliferating fibroblasts, fibroblasts contact-inhibited for 11 d (CI11), or SS7 fibroblasts were treated with ethanol vehicle control or varying amounts of DHEA dissolved in ethanol for 4 d. Cells were analyzed for caspase-3/7 activity by monitoring luminescence emission of a caspase-3/7 substrate. Data were normalized to the vehicle control. For proliferating versus CI11 cells, results are an average of four experiments with 2–3 replicates; error bars represent standard error and asterisks indicate statistical significance of p<0.05. Normalized caspase-3/7 activity in CI11 and proliferating cells was statistically significantly different at all doses except 100 µM. For proliferating versus SS7 cells, data represent three experiments with three replicates in each. Normalized caspase activity in SS7 and proliferating cells was statistically significantly different at all doses.
Figure 7
Figure 7. A truncated TCA cycle in proliferating but not contact-inhibited fibroblasts.
Proliferating (P), CI7, and CI14 fibroblasts were switched from unlabeled to [U-13C]-glucose at time zero. The graphs show the fractional incorporation of 13C into the indicated metabolites over time. Data represent averages from three experiments, and error bars indicate standard deviation. Note the minimal labeling of α-ketoglutarate and succinate in the proliferating cells.
Figure 8
Figure 8. Glutamine drives both clockwise and counterclockwise flux through the TCA cycle.
(A) Proliferating (P), CI7, or CI14 fibroblasts were incubated with [U-13C]-glutamine. Metabolites were harvested and their extent of labeling measured by LC-MS/MS. α-Ketoglutarate in the TCA cycle can be converted to succinate in the clockwise (or “forward”) direction or converted to citrate in the counterclockwise (or “reverse”) direction. The only known route to 5×13C-citrate is via this “reverse” flux from α-ketoglutarate. 5×13C-Citrate can then be converted to 3×13C-malate by ATP-citrate lyase to produce acetyl-CoA to drive fatty acid biosynthesis. Data represent the average of four experiments. Error bars indicate standard deviations. (B) IDH1 is upregulated at the transcript and protein level in quiescent fibroblasts. Transcript levels of IDH1 were monitored in two independent experiments (indicated with subscripts) of proliferating, CI7, and CI14 fibroblasts by microarray (left panel). Data are shown in a heatmap format with elevated expression in quiescent cells shown in red and decreased expression in quiescent cells in green. Results are shown for multiple isocitrate dehydrogenase isozymes. Protein levels for IDH1, a metabolic enzyme that catalyzes the conversion of isocitrate to α-ketoglutarate and thereby generates NADPH, were monitored by immunoblotting (right panel). GAPDH was monitored as a loading control. (C) Proliferating, CI7, CI14, and CI14SS7 fibroblasts were incubated with [U-14C]-glutamine for 24 h. Fatty acids were extracted, and 14C incorporation was determined by scintillation counting and normalized for the amount of protein present. Error bars indicate standard error. p-Values were determined with the Student's t test, and asterisks indicate p<0.05. For CI7 versus proliferating, p = 0.0025; for CI14 versus proliferating, p = 0.018; for CI14SS7 versus proliferating, p = 0.0001.
Figure 9
Figure 9. Labeled glutamate levels decrease with time after switching into [U-13C]-glutamine in CI7 and CI14 but not proliferating fibroblasts.
Proliferating (P), CI7, or CI14 fibroblasts were switched from unlabeled medium to medium containing [U-13C]-glutamine, and the fraction of fully labeled glutamate (left plot) and unlabeled glutamate (right plot) was determined over time. Results are an average of four experiments, and error bars indicate standard deviations.
Figure 10
Figure 10. Contact-inhibited fibroblasts secrete high levels of specific extracellular matrix proteins.
Conditioned medium (4 d) was collected from proliferating (P) and CI14 fibroblasts conditioned with either no serum or 0.1% serum, and with 0.03% platelet-derived growth factor (PDGF-BB) for proliferating cells. The amount of conditioned medium was normalized to the change in protein content over time. Conditioned medium was precipitated and immunoblotted with an antibody to fibronectin, collagen (col21a1), or laminin (lama2).

Similar articles

Cited by

References

    1. Werner-Washburne M, Braun E, Johnston G. C, Singer R. A. Stationary phase in the yeast Saccharomycer cerevisiae. Microbiol. Rev. 1993;57:383–401. - PMC - PubMed
    1. Gray J. V, Petsko G. A, Johnston G. C, Ringe D, Singer R. A, et al. “Sleeping beauty”: quiescence in Saccharomyces cerevisiae. Microbiol Mol Biol Rev. 2004;68:187–206. - PMC - PubMed
    1. Noda T, Ohsumi Y. Tor, a phosphatidylinositol kinase homologue, controls autophagy in yeast. J Biol Chem. 1998;273:3963–3966. - PubMed
    1. Choder M. A general topoisomerase I-dependent transcriptional repression in the stationary phase in yeast. Genes Dev. 1991;5:2315–2326. - PubMed
    1. Fuge E. K, Braun E. L, Werner-Washburne M. Protein synthesis in long-term stationary-phase cultures of Saccharomyces cerevisiae. J Bacteriol. 1994;176:5802–5813. - PMC - PubMed

Publication types