

Module discovery by exhaustive search for densely connected, co-expressed regions in biomolecular interaction networks
- PMID: 21049092
- PMCID: PMC2963598
- DOI: 10.1371/journal.pone.0013348
Module discovery by exhaustive search for densely connected, co-expressed regions in biomolecular interaction networks
Erratum in
- PLoS One. 2010;5(12) doi: 10.1371/annotation/ab9e87d9-f59c-4dab-aea5-a3c1116d3d85 doi: 10.1371/annotation/ab9e87d9-f59c-4dab-aea5-a3c1116d3d85
Abstract
Background: Computational prediction of functionally related groups of genes (functional modules) from large-scale data is an important issue in computational biology. Gene expression experiments and interaction networks are well studied large-scale data sources, available for many not yet exhaustively annotated organisms. It has been well established, when analyzing these two data sources jointly, modules are often reflected by highly interconnected (dense) regions in the interaction networks whose participating genes are co-expressed. However, the tractability of the problem had remained unclear and methods by which to exhaustively search for such constellations had not been presented.
Methodology/principal findings: We provide an algorithmic framework, referred to as Densely Connected Biclustering (DECOB), by which the aforementioned search problem becomes tractable. To benchmark the predictive power inherent to the approach, we computed all co-expressed, dense regions in physical protein and genetic interaction networks from human and yeast. An automatized filtering procedure reduces our output which results in smaller collections of modules, comparable to state-of-the-art approaches. Our results performed favorably in a fair benchmarking competition which adheres to standard criteria. We demonstrate the usefulness of an exhaustive module search, by using the unreduced output to more quickly perform GO term related function prediction tasks. We point out the advantages of our exhaustive output by predicting functional relationships using two examples.
Conclusion/significance: We demonstrate that the computation of all densely connected and co-expressed regions in interaction networks is an approach to module discovery of considerable value. Beyond confirming the well settled hypothesis that such co-expressed, densely connected interaction network regions reflect functional modules, we open up novel computational ways to comprehensively analyze the modular organization of an organism based on prevalent and largely available large-scale datasets.
Availability: Software and data sets are available at http://www.sfu.ca/~ester/software/DECOB.zip.
Conflict of interest statement
Figures
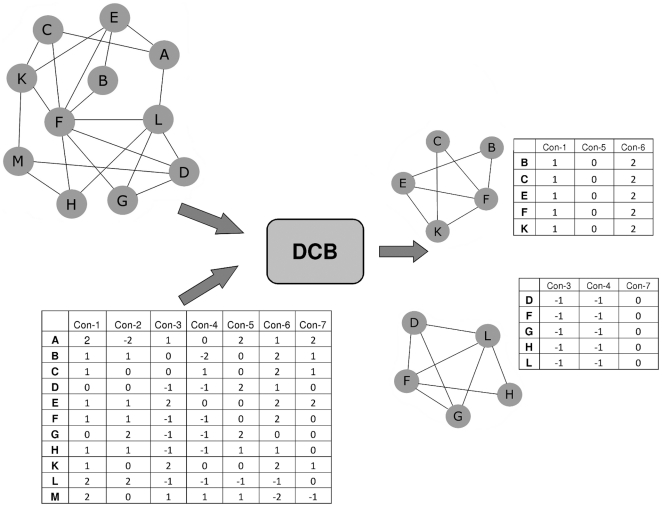
 times the amount of possible edges and its genes are co-expressed in at least
  different experimental conditions (
 ) with a difference of at most
  (
( ).
).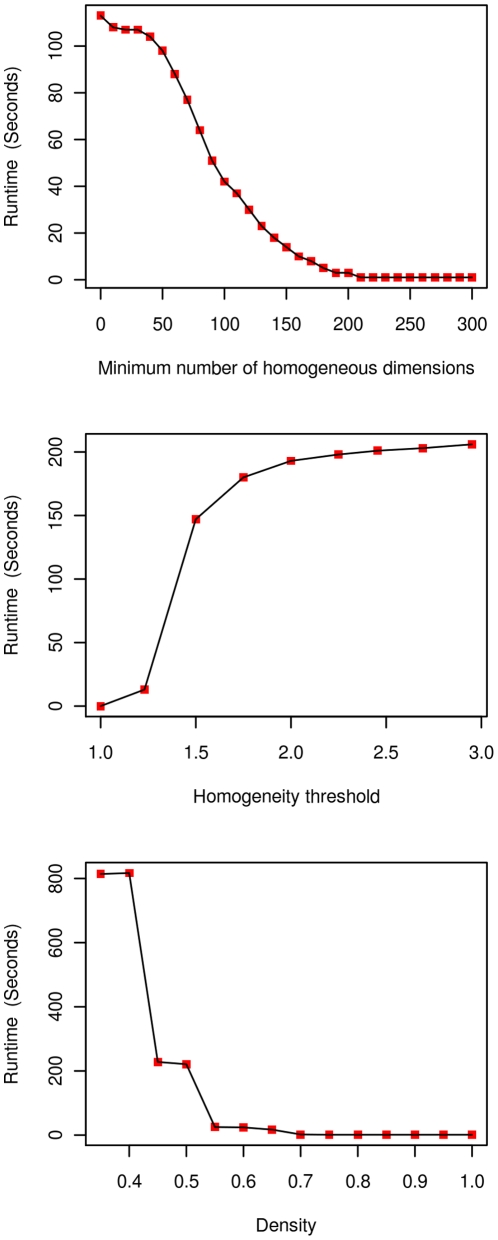
 (density).
 (density),
  (maximum difference in expression) and
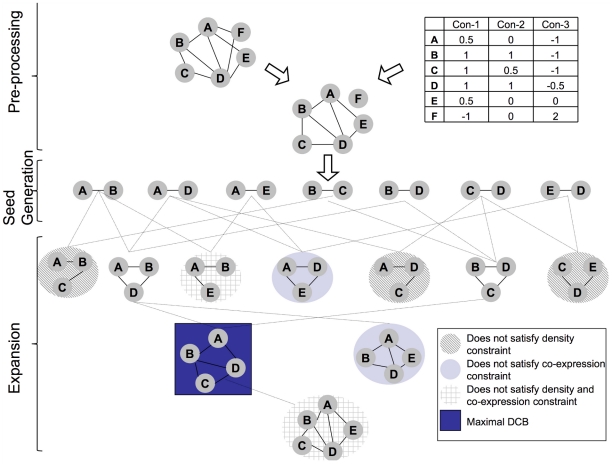
  (number of expression conditions). The algorithmic strategy is to traverse the lattice of all subnetworks in a breadth-first fashion. Any subnetwork which is not a densely connected biclusters can be discarded due to that every densely connected bicluster necessarily has a densely connected bicluster as a parent ( = subnetwork contained in the original one, see definitions 1 and 3 and the surrounding discussions). For esthetical reasons, we have omitted B-C-D-E although, as a child of the densely connected bicluster B-C-D, it is also examined. B-C-D-E, just as A-B-D-E will be discarded since it violates the density constraint.
References
-
- Albert R. Scale-free networks in cell biology. J of Cell Science. 2005;118:4947–4957. - PubMed
-
- Ge H, Liu Z, Church GM, Vidal M. Correlation between transcriptome and interactome mapping data from Saccharomyces cerevisiae. Nature Genetics. 2001;29(4):482–486. - PubMed
-
- de Lichtenberg U, Jensen LJ, Brunak S, Bork P. Dynamic complex formation during the yeast cell cycle. Science. 2005;307:724–727. - PubMed
-
- Tong AHY, Lesage G, Bader GD, Ding H, Xu H, et al. Global Mapping of the Yeast Genetic Interaction Network. Science. 2004;303:808–813. - PubMed
Publication types
MeSH terms
Grants and funding
LinkOut - more resources
Full Text Sources
Molecular Biology Databases
