Mapping the encounter state of a transient protein complex by PRE NMR spectroscopy
- PMID: 21049303
- PMCID: PMC3235994
- DOI: 10.1007/s10858-010-9452-6
Mapping the encounter state of a transient protein complex by PRE NMR spectroscopy
Abstract
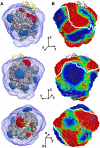
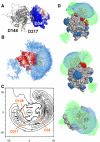
Many biomolecular interactions proceed via a short-lived encounter state, consisting of multiple, lowly-populated species invisible to most experimental techniques. Recent development of paramagnetic relaxation enhancement (PRE) nuclear magnetic resonance (NMR) spectroscopy has allowed to directly visualize such transient intermediates in a number of protein-protein and protein-DNA complexes. Here we present an analysis of the recently published PRE NMR data for a protein complex of yeast cytochrome c (Cc) and cytochrome c peroxidase (CcP). First, we describe a simple, general method to map out the spatial and temporal distributions of binding geometries constituting the Cc-CcP encounter state. We show that the spatiotemporal mapping provides a reliable estimate of the experimental coverage and, at higher coverage levels, allows to delineate the conformational space sampled by the minor species. To further refine the encounter state, we performed PRE-based ensemble simulations. The generated solutions reproduce well the experimental data and lie within the allowed regions of the encounter maps, confirming the validity of the mapping approach. The refined encounter ensembles are distributed predominantly in a region encompassing the dominant form of the complex, providing experimental proof for the results of classical theoretical simulations.
Figures


Similar articles
-
Structure and Function of Transient Encounters of Redox Proteins.Acc Chem Res. 2015 Dec 15;48(12):3036-43. doi: 10.1021/acs.accounts.5b00343. Epub 2015 Nov 25. Acc Chem Res. 2015. PMID: 26606503 Review.
-
Visualization of the encounter ensemble of the transient electron transfer complex of cytochrome c and cytochrome c peroxidase.J Am Chem Soc. 2010 Jan 13;132(1):241-7. doi: 10.1021/ja9064574. J Am Chem Soc. 2010. PMID: 19961227
-
The cytochrome c peroxidase and cytochrome c encounter complex: the other side of the story.FEBS Lett. 2014 May 21;588(10):1873-8. doi: 10.1016/j.febslet.2014.03.055. Epub 2014 Apr 12. FEBS Lett. 2014. PMID: 24726731
-
The Transient Complex of Cytochrome c and Cytochrome c Peroxidase: Insights into the Encounter Complex from Multifrequency EPR and NMR Spectroscopy.Chemphyschem. 2020 May 18;21(10):1060-1069. doi: 10.1002/cphc.201901160. Epub 2020 Apr 17. Chemphyschem. 2020. PMID: 32301564 Free PMC article.
-
The complex of cytochrome c and cytochrome c peroxidase: the end of the road?Biochim Biophys Acta. 2011 Nov;1807(11):1482-503. doi: 10.1016/j.bbabio.2011.07.010. Epub 2011 Jul 28. Biochim Biophys Acta. 2011. PMID: 21820401 Review.
Cited by
-
Electron transfer interactome of cytochrome C.PLoS Comput Biol. 2012;8(12):e1002807. doi: 10.1371/journal.pcbi.1002807. Epub 2012 Dec 6. PLoS Comput Biol. 2012. PMID: 23236271 Free PMC article.
-
Fast NMR data acquisition from bicelles containing a membrane-associated peptide at natural-abundance.J Phys Chem B. 2011 Nov 3;115(43):12448-55. doi: 10.1021/jp2076098. Epub 2011 Oct 11. J Phys Chem B. 2011. PMID: 21939237 Free PMC article.
-
Visualizing transient dark states by NMR spectroscopy.Q Rev Biophys. 2015 Feb;48(1):35-116. doi: 10.1017/S0033583514000122. Q Rev Biophys. 2015. PMID: 25710841 Free PMC article.
-
A model of the membrane-bound cytochrome b5-cytochrome P450 complex from NMR and mutagenesis data.J Biol Chem. 2013 Jul 26;288(30):22080-95. doi: 10.1074/jbc.M112.448225. Epub 2013 May 24. J Biol Chem. 2013. PMID: 23709268 Free PMC article.
-
NMR-based conformational ensembles explain pH-gated opening and closing of OmpG channel.J Am Chem Soc. 2013 Oct 9;135(40):15101-13. doi: 10.1021/ja408206e. Epub 2013 Oct 1. J Am Chem Soc. 2013. PMID: 24020969 Free PMC article.
References
-
- Adam G, Delbruck M. Structural chemistry and molecular biology. San Francisco: Freeman; 1968. pp. 198–215.
Publication types
MeSH terms
Substances
LinkOut - more resources
Full Text Sources
Molecular Biology Databases

