

Review
doi: 10.1021/cr1001436.
Epub 2010 Nov 4.
Theory of coupled electron and proton transfer reactions
Affiliations
- PMID: 21049940
- PMCID: PMC3005854
- DOI: 10.1021/cr1001436
Item in Clipboard
Review
Theory of coupled electron and proton transfer reactions
Chem Rev.
.
No abstract available
Figures
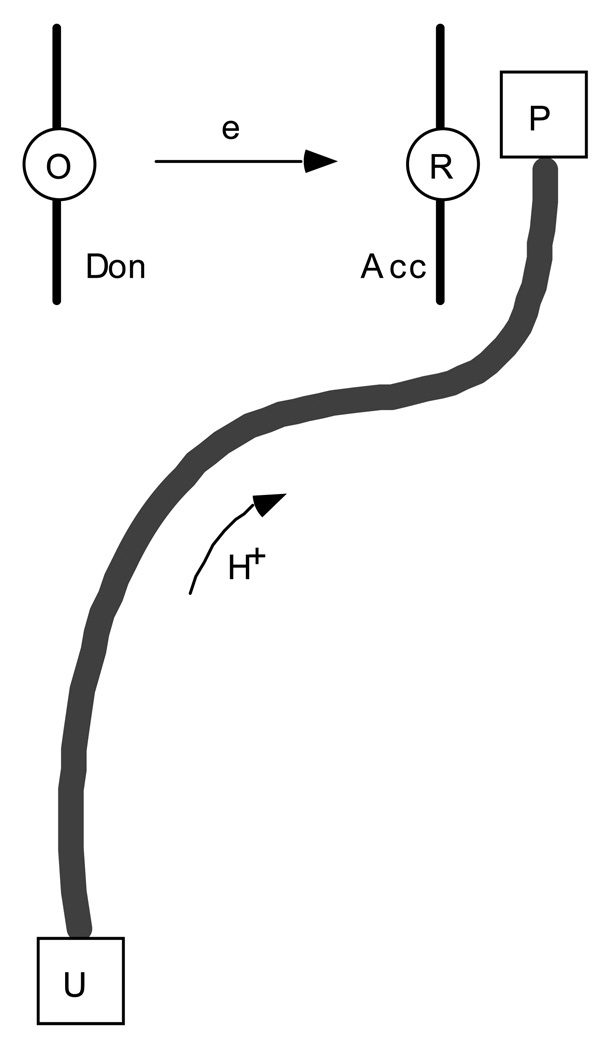
Schematics of the electron transfer reaction coupled to proton translocation. In the reaction, an electron is tunneling over a long distance between two redox cofactors, O and R, and a coupled proton is transferred over a proton conducting channel. The initial and final states of the proton are two protonatable groups of the protein, U and P. Separately, both electron and proton transfer are uphill in energy, however, the coupled reaction is downhill. Figure reprinted with permission from Ref. . Copyright 2003 World Scientific.
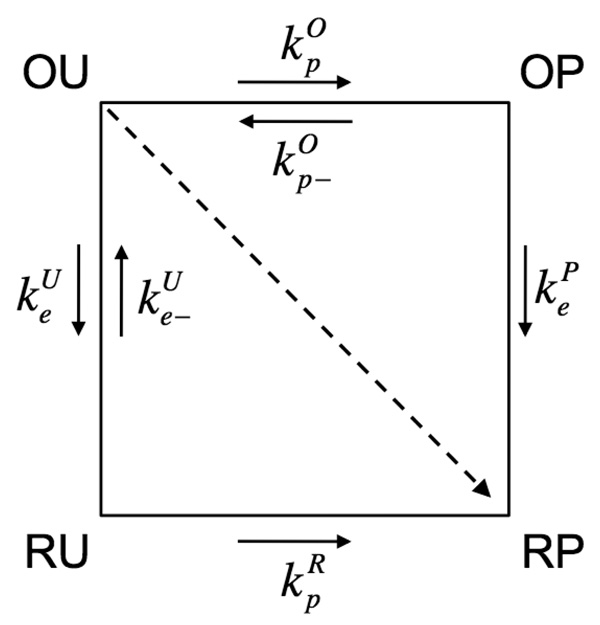
Four-state model for coupled electron and proton transfer reactions. In the initial state (OU), the electron is on the donor site O (Oxidized acceptor), and the proton is on the U site (Unprotonated acceptor). In the final state (RP), the electron is on the acceptor site R (Reduced acceptor), and the proton is on the P site (Protonated acceptor). Intermediate states (OP) and (RU) correspond to activated states for sequential PT/ET and ET/PT reactions. The concerted reaction corresponds to an (OU) to (RP) transition. Figure reprinted with permission from Ref. . Copyright 2003 World Scientific.
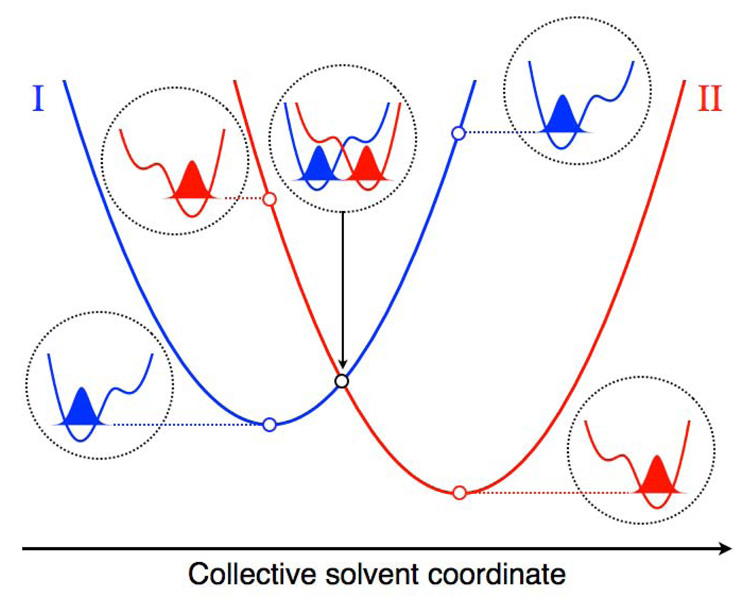
Slices of the free energy surfaces for the ground reactant (I) and product (II) vibronic states along a collective solvent coordinate. The proton potential energy curves along the proton coordinate and the corresponding ground state proton vibrational wavefunctions are depicted for the reactant minimum, the crossing point, and the product minimum of the free energy curves. The energies of these proton vibrational states correspond to the open circles on the free energy curves. The proton potential energy curves associated with the crossing point are shifted higher in energy for clarity. Figure and caption reprinted with permission from Ref. . Copyright 2008 American Chemical Society.
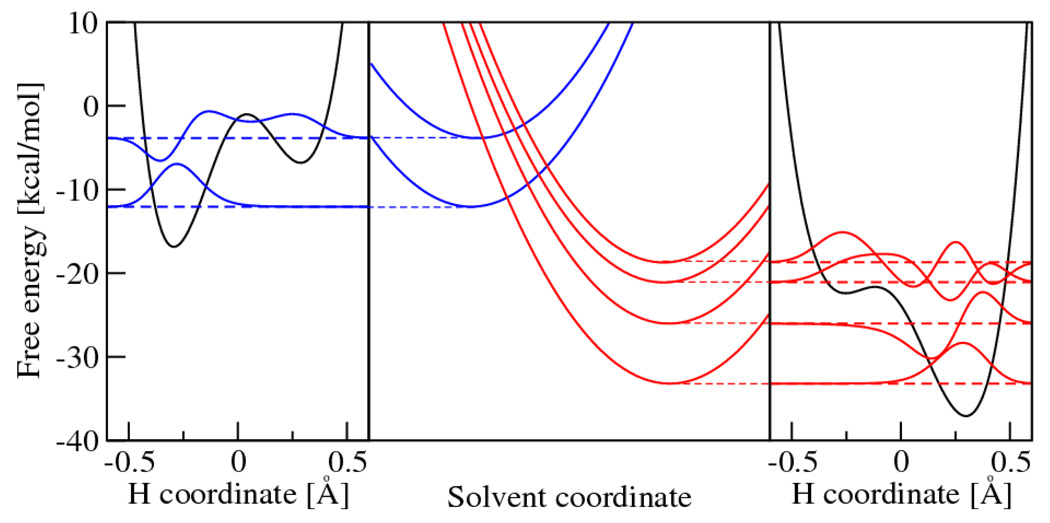
Calculated free energy curves for the PCET reaction in a rhenium-tyrosine complex. In the center frame are slices of the free energy surfaces along a collective solvent coordinate. In the left/right frames are the reactant/product proton potential energy curves and the corresponding proton vibrational wavefunctions along the proton coordinate. Figure reprinted with permission from Ref. . Copyright 2007 American Chemical Society.
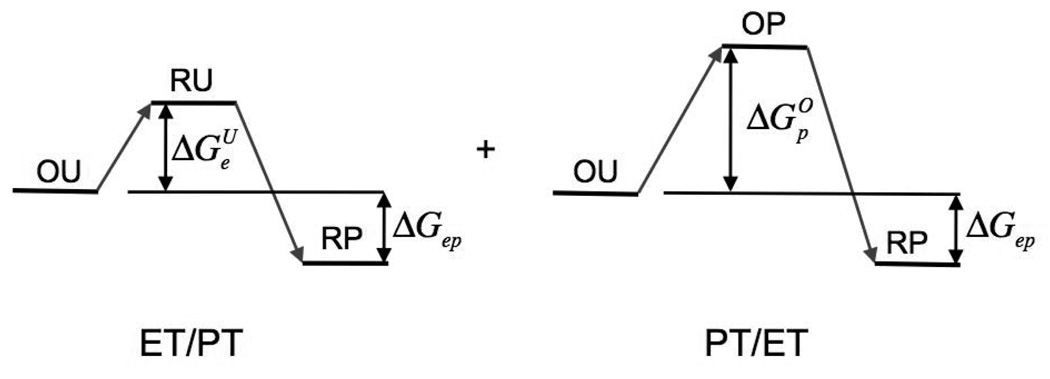
Free energies of sequential ET/PT and PT/ET reactions shown in Fig. 2. Figure reprinted with permission from Ref. . Copyright 2003 World Scientific.
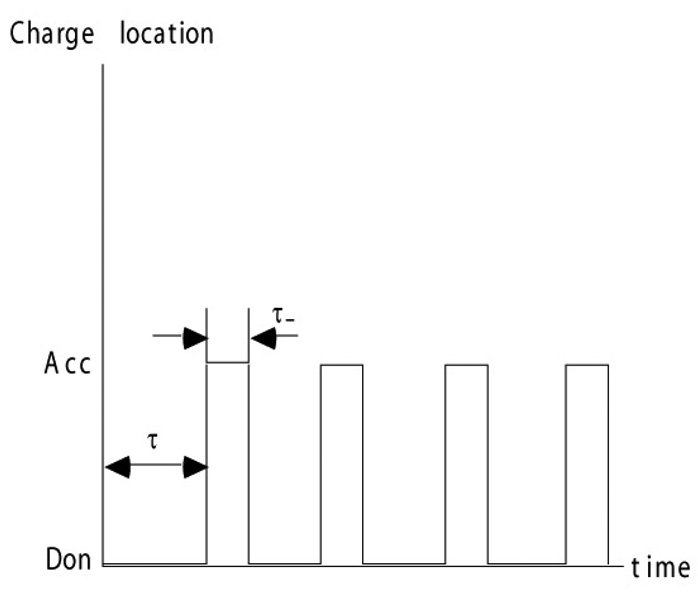
Random transitions of charge between donor and acceptor states in an ET or PT reaction of a single molecule assumed in the four-state model. Figure reprinted with permission from Ref. . Copyright 2003 World Scientific.
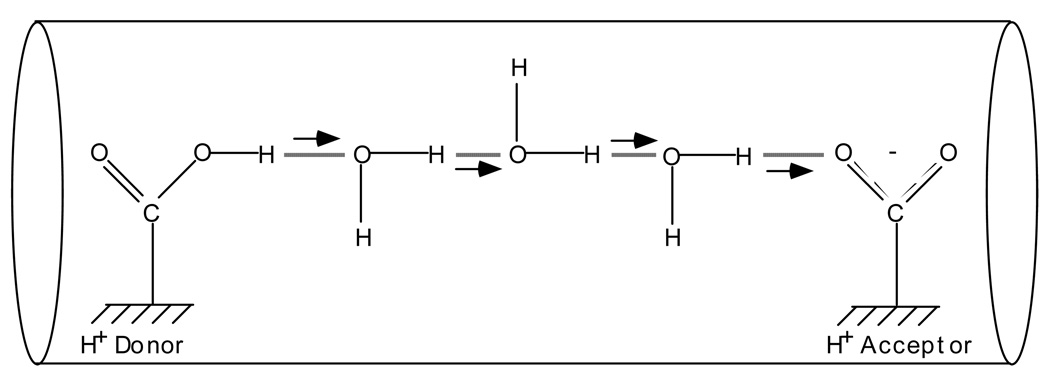
Qualitative scheme of proton transfer via a chain of hydrogen bonds in a proton conducting channel. The proton transfer can occur either as a random walk of a localized charge along the chain, or as a single transition of a delocalized soliton-like object, in which several protons along the chain are transferred simultaneously. Figure reprinted with permission from Ref. . Copyright 2003 World Scientific.
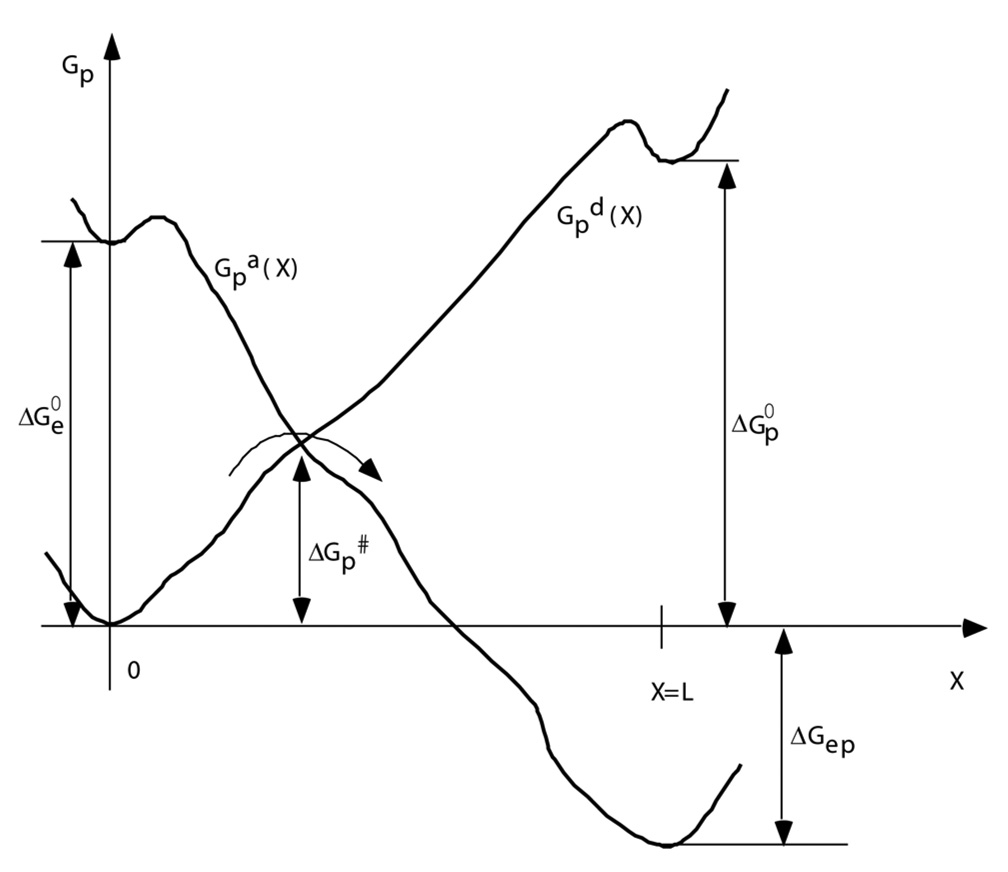
Qualitative free energy profiles along the proton conducting channel. The initial and final states of the proton (i.e., the centers of positive charge for these two states) are at X=0, and X=L, respectively. The two curves correspond to electron Oxidized (O) and Reduced (R) states, respectively. are the free energies of electron and proton (uphill) transfer, respectively, in the uncoupled reaction. For the slow proton diffusion case, the effective potential is the lower of the two curves for a given X. is the activation free energy for such a reaction. Figure reprinted with permission from Ref. . Copyright 2003 World Scientific.
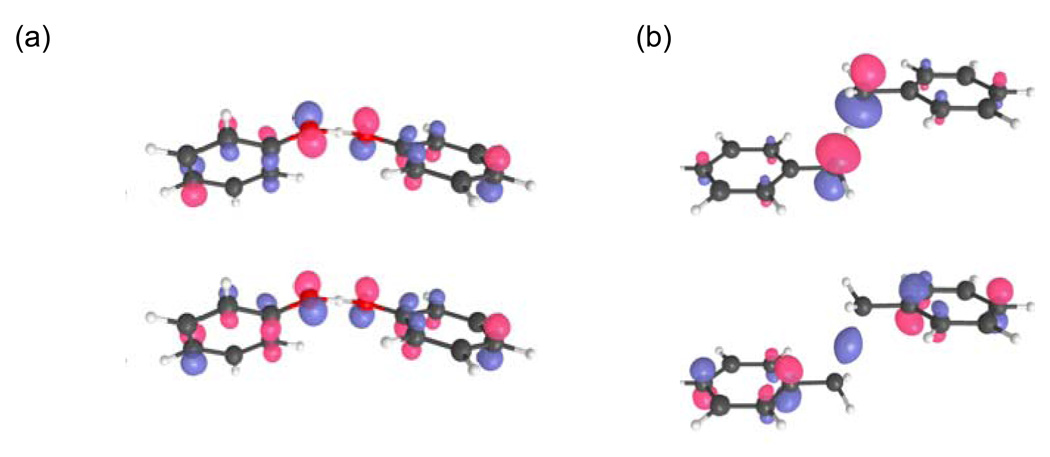
The two highest-energy occupied molecular orbitals for (a) the phenoxyl/phenol and (b) the benzyl/toluene system for the transition state structures. Figure reprinted with permission from Ref. . Copyright 2006 American Chemical Society.
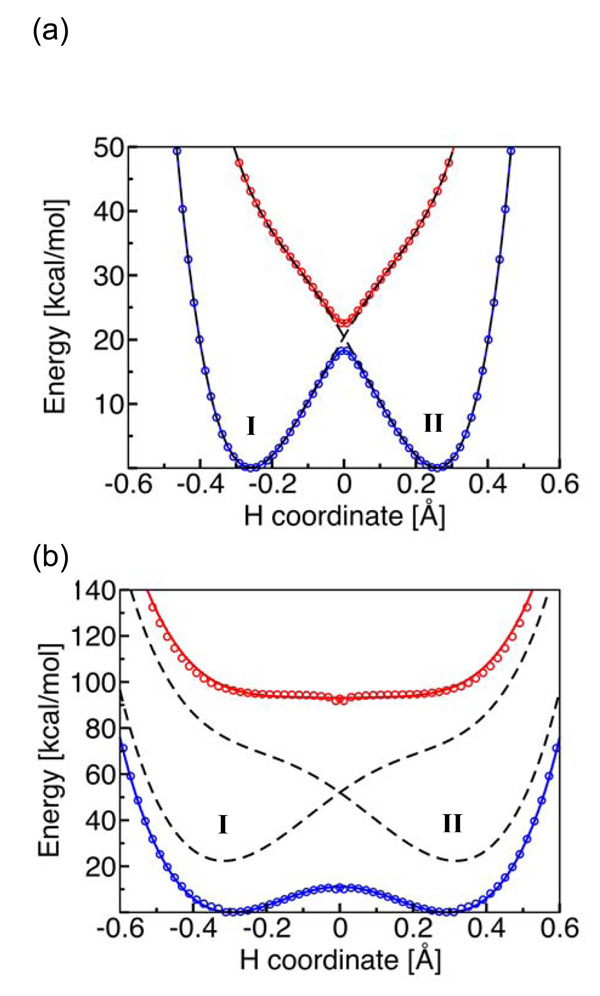
State-averaged CASSCF ground and excited state electronically adiabatic potential energy curves along the transferring hydrogen coordinate for (a) the phenoxyl/phenol and (b) the benzyl/toluene system. The coordinates of all nuclei except the transferring hydrogen correspond to the transition state geometry. The CASSCF results are depicted as open circles that are blue for the ground state and red for the excited state. The black dashed lines represent the diabatic potential energy curves corresponding to the two localized diabatic states I and II. The mixing of these two diabatic states with the electronic coupling Vel leads to the CASSCF ground and excited state electronically adiabatic curves depicted with solid colored lines following the colored open circles. For the phenoxyl/phenol system, the solid colored lines and the black dashed lines are nearly indistinguishable because the adiabatic and diabatic potential energy curves are virtually identical except in the transition state region. Figure and caption reprinted with permission from Ref. . Copyright 2006 American Chemical Society.
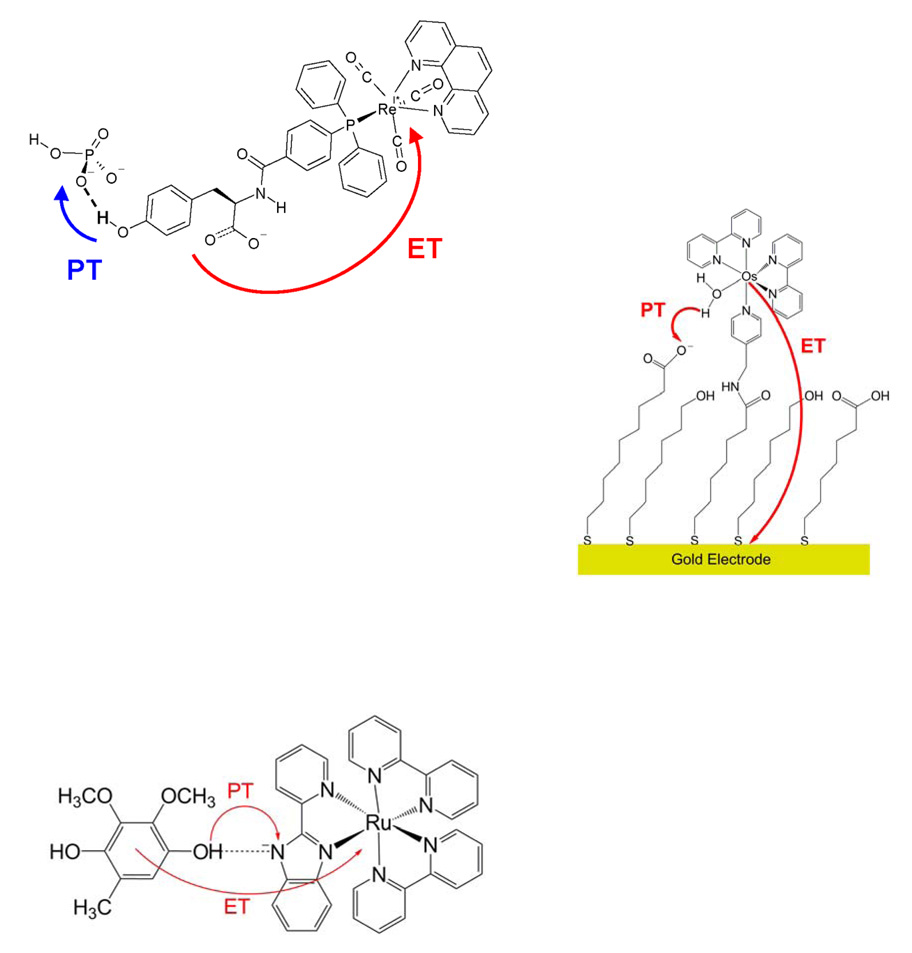
PCET systems studied theoretically with the framework described in Section 2. Figures reprinted with permission from Refs. ,,. Copyright 2009, 2007, and 2010 American Chemical Society.
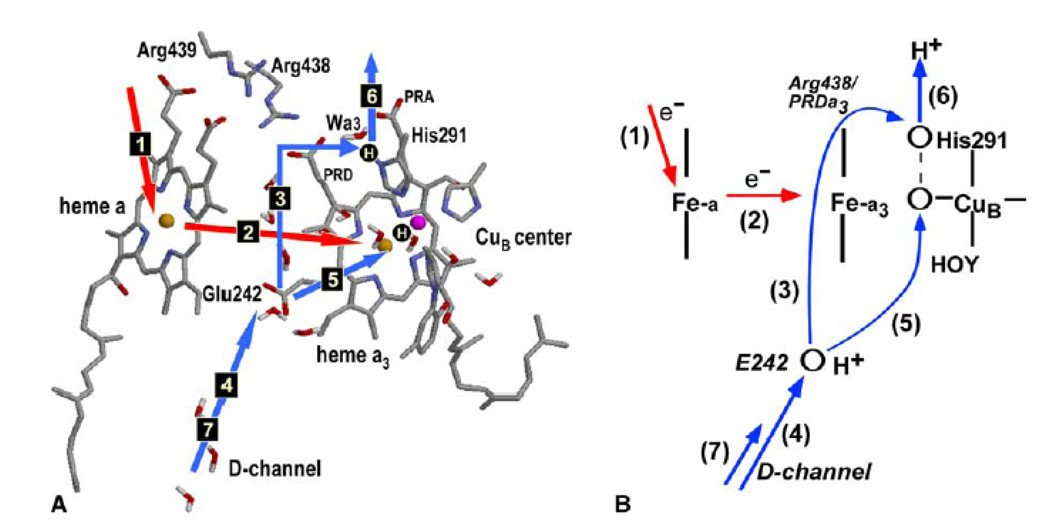
(A) The key structural elements of the proposed pumping mechanism of CcO and the sequence of transitions during one pumping cycle. Two protonation sites, the PLS and a site in the BNC, are shown as H-circles. PT and ET steps are shown by blue and red arrows, respectively. The residue notation is for bovine enzyme. (B) Schematic depiction of the model. The key assumption of the model is that upon ET between the hemes (step 2), the proton transfer to the Proton Loading Site (step 3) occurs before the proton transfer to the BNC (step 5). Figure reprinted with permission from Ref. . Copyright 2004 Elsevier.
References
-
- Nicholls DG, Ferguson S. Bioenergetics 2. San Diego: Academic Press; 1992.
-
- Cramer WA, Knaff DB. Energy transduction in biological membranes. New York: Springer-Verlag; 1990.
-
- Skulachev VP. Membrane bioenergetics. New York: Springer-Verlag; 1988.
-
- Wikström M. Curr. Opin. Struct. Biol. 1998;8:480. - PubMed
-
- Michel H. Biochemistry. 1999;38:15129. - PubMed
Publication types
MeSH terms
Substances
Grants and funding
LinkOut - more resources
Full Text Sources
