

doi: 10.1021/jp106578f.
Epub 2010 Nov 4.
Length scale dependence of the dynamic properties of hyaluronic acid solutions in the presence of salt
Affiliations
- PMID: 21049966
- PMCID: PMC3615649
- DOI: 10.1021/jp106578f
Item in Clipboard
Length scale dependence of the dynamic properties of hyaluronic acid solutions in the presence of salt
J Phys Chem B.
.
Abstract
In solutions of the charged semirigid biopolymer hyaluronic acid in salt-free conditions, the diffusion coefficient D(NSE) measured at high transfer momentum q by neutron spin echo is more than an order of magnitude smaller than that determined by dynamic light scattering, D(DLS). This behavior contrasts with neutral polymer solutions. With increasing salt content, D(DLS) approaches D(NSE), which is independent of ionic strength. Contrary to theoretical expectation, the ion-polymer coupling, which dominates the low q dynamics of polyelectrolyte solutions, already breaks down at distance scales greater than the Debye-Hückel length.
Figures

Variation of the hydrodynamic correlation length ξ = kBT/(6πηD) with ionic strength J in 2% w/w solutions of HA. The slope of the power law fit is 0.64±0.04.

SAXS spectrum of a 2% w/w HA solution in 0.1M NaCl (filled symbols). SLS response of the same solution (open symbols). The size of each symbol reflects the range of the experimental error.

Dependence on q of the NSE scattering intensity from 2% w/w HA solutions at different ionic strengths.

Intensity correlation function g2(t) -1 from HA solution containing 0.1 M NaCl + 0.05 M CaCl2, measured at θ=90°. Continuous line: fit to eq 8, dashed line : slow component of eq 8.
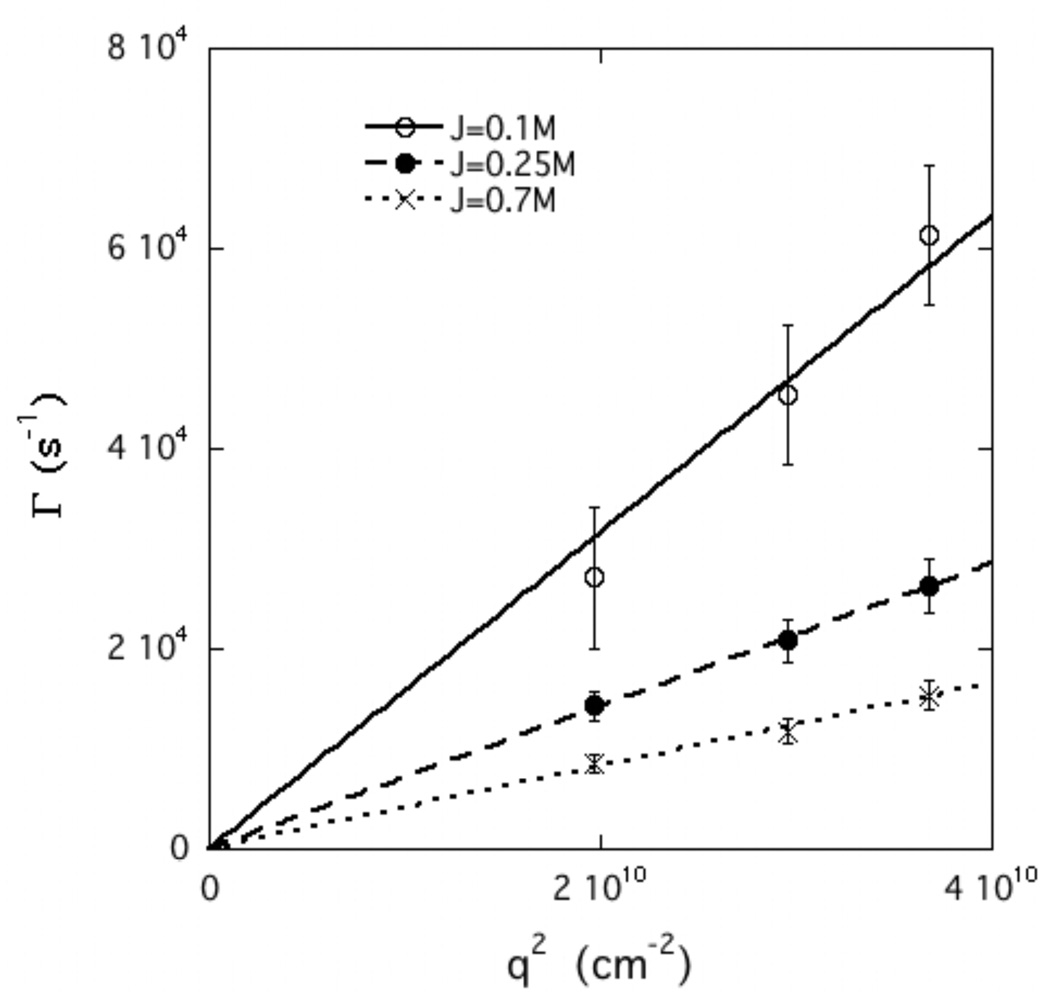
DLS relaxation rate Γ vs q2 of fast decay for 2% w/w HA solutions in 0.1 M NaCl, 0.1 M NaCl + 0.05 M CaCl2, and 0.1 M NaCl + 0.2 M CaCl2.

Dependence on q3 of the slow relaxation rate Γs for 2% w/w HA solutions in 100 mM NaCl (open symbols) and in 0.1 mM NaCl + 0.1 mM CaCl2 (filled symbols)

NSE echo decay at q=0.087 Å−1 for same sample as in Figure 3.

NSE relaxation rate Γ vs q2, for 2% HA solutions in zero added salt (●), 0.1 M NaCl + 0.05 M CaCl2 (○), and 0.1 M NaCl + 0.1 M CaCl2 (×).

Left axis: dependence of diffusion coefficient D on J in 2% w/w HA solutions; O: DDLS, ●: DNSE; continuous line : mode coupling model (eq 7) with D1=3×10⁻⁷ cm2s−1, D2=D3=2×10⁻⁵ cm2s−1, Z1=−4.5. Right axis : dependence of osmotic modulus c∂Π/∂c on J (♦).
References
-
- de Gennes PG. Scaling Concepts in Polymer Physics. Ithaca, NY: Cornell; 1979.
-
- Muthukumar M. J. Chem. Phys. 2004;120:9343. - PubMed
-
- Zhang Y, Douglas JF, Ermi BD, Amis E. J. Chem. Phys. 2001;114:3299.
-
- Mezei F. Neutron Spin Echo, Lecture Notes in Physics. Vol. 128. Berlin: Springer; 1980.
-
- Hecht A-M, Guillermo A, Horkay F, Mallam S, Legrand JF, Geissler E. Macromolecules. 1992;25:3677.
Publication types
MeSH terms
Substances
Grants and funding
LinkOut - more resources
Full Text Sources
