Review
. 2011 Feb;9(1):13-20.
doi: 10.1089/adt.2010.0308. Epub 2010 Nov 4.

Cell-based screening using high-throughput flow cytometry

Affiliations
Review

Cell-based screening using high-throughput flow cytometry

Christopher B Black et al. Assay Drug Dev Technol. 2011 Feb.

Abstract

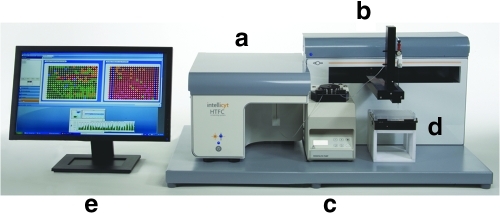
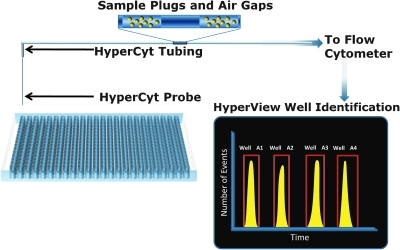
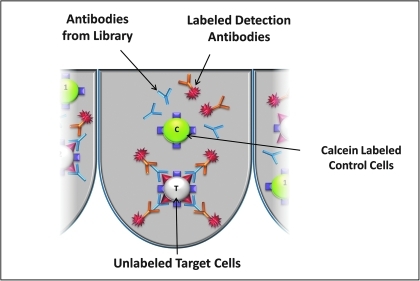
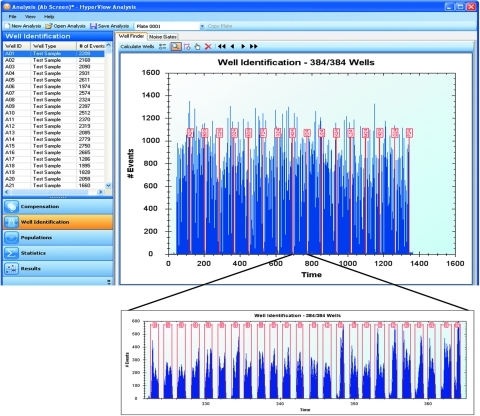
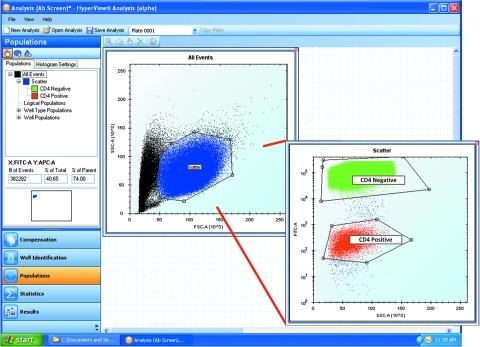
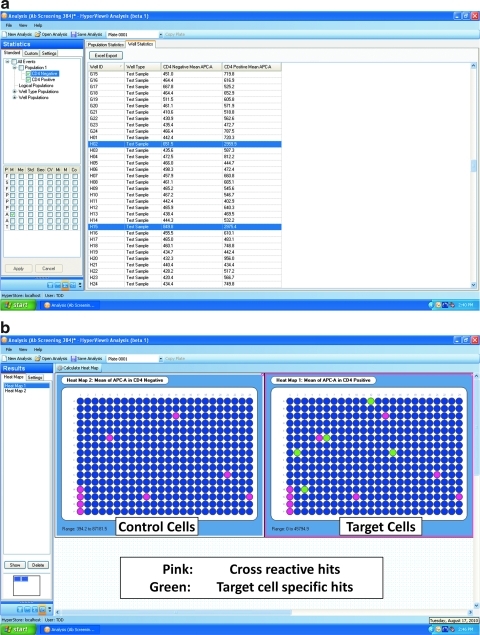
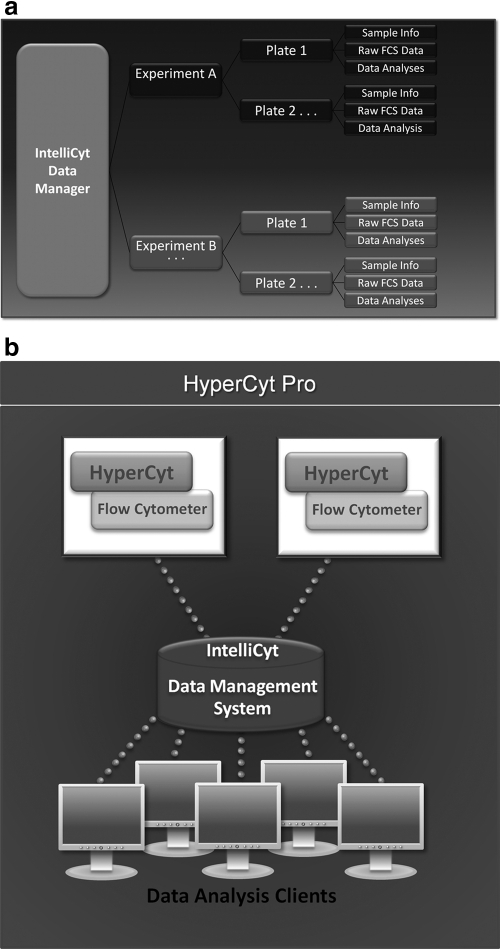
This review describes the use of high-throughput flow cytometry for performing multiplexed cell-based and bead-based screens. With the many advances in cell-based analysis and screening, flow cytometry has historically been underutilized as a screening tool largely due to the limitations in handling large numbers of samples. However, there has been a resurgence in the use of flow cytometry due to a combination of innovations around instrumentation and a growing need for cell-based and bead-based applications. The HTFC™ Screening System (IntelliCyt Corporation, Albuquerque, NM) is a novel flow cytometry-based screening platform that incorporates a fast sample-loading technology, HyperCyt®, with a two-laser, six-parameter flow cytometer and powerful data analysis capabilities. The system is capable of running multiplexed screening assays at speeds of up to 40 wells per minute, enabling the processing of a 96- and 384-well plates in as little as 3 and 12 min, respectively. Embedded in the system is HyperView®, a data analysis software package that allows rapid identification of hits from multiplexed high-throughput flow cytometry screening campaigns. In addition, the software is incorporated into a server-based data management platform that enables seamless data accessibility and collaboration across multiple sites. High-throughput flow cytometry using the HyperCyt technology has been applied to numerous assay areas and screening campaigns, including efflux transporters, whole cell and receptor binding assays, functional G-protein-coupled receptor screening, in vitro toxicology, and antibody screening.


Figures

Fig. 1.
Fig. 1.
The HTFC Screening System (IntelliCyt Corporation). (a) 2-laser, 4-color flow cytometer; (b) an x, y, z autosampler; (c) a low pulsation peristaltic pump; (d) orbital plate shaker that accommodates 96- and 384-well plates; (e) system computer with HyperView installed to set up experiments and process plate data.
Fig. 2.
Fig. 2.
Depiction of the HyperCyt sampling process. The HTFC Screening System utilizes a low pulsation peristaltic pump to transfer samples from microplates into the flow cytometer via the sample tubing. Samples are separated one from another by air gaps. The stream of samples and air gaps traverse the tubing to the flow cell of the cytometer for detection. The cytometer collects data continuously resulting in a time-resolved histogram, which is graphically shown. HyperView software deconvolves this data formatting it in to a plate layout.
Fig. 3.
Fig. 3.
Application example illustrating a multiplex antibody detection screen to highlight how HyperView software is used. The experiments used mixtures of cell lines, which either expressed human CD4 or did not. Screening for antibodies in a hybridoma library that specifically bind to CD4 were assessed by monitoring both populations of cells simultaneously on the flow cytometer.
Fig. 4.
Fig. 4.
Screenshot from HyperView showing an example of the Well Identification process. Data from the 384-well plate is collected in to a single flow cytometry standard file, which is shown in the main window. The data are deconvolved by the software algorithm to identify each peak with a well address on the plate. One row is expanded to show temporally spaced individual peaks.
Fig. 5.
Fig. 5.
Screenshot of HyperView software. On the left window pane are the populations and histogram settings above the workflow process tabs. In this example, the Well Identification process has been completed and analysis of the populations is being shown. On the right side of the screen is the virtual desktop that accommodates many plots at the same time for ease of data viewing. A miniature version of the virtual desktop is shown in the middle of the left window pane.
Fig. 6.
Fig. 6.
Statistics results and heat maps from HyperView. (a) The statistics window shows selected parameters for each population of events identified in the Populations tab. For all channels, a number of statistical parameters can be selected. Two of the rows are highlighted to show how potential binding hits would appear. (b) Heat maps are shown from the hybridoma screening experiment described in the text. The blue color indicates low antibody binding and pink/red/green represent high antibody binding. In this example, both CD4-positive and CD4-negative cells are in each well. Specific hits for CD4 binding are represented by wells that have signal in the CD4-positive map (green) but not in the CD4-negative or control cells map (red/pink).
Fig. 7.
Fig. 7.
Schematic of the iDM platform. iDM functions on two levels. (a) The iDM system tracks raw data, experimental parameters, sample information, and analyses from each plate and associates it with an experiment. (b) The system coordinates multiple HTFC Screening Systems and HyperView clients, allowing the data from each system to be accessed by multiple researchers. iDM, IntelliCyt Data Manager.

Similar articles

Cited by

References

    1. Feng Y. Mitchison TJ. Bender A. Young DW. Tallarico JA. Multi-parameter phenotypic profiling: using cellular effects to characterize small-molecule compounds. Nat Rev Drug Discov. 2009;8:567–578. - PubMed
    1. Edwards BS. Kuckuck FW. Prossnitz ER. Ransom JT. Sklar LA. HTPS flow cytometry: a novel platform for automated high throughput drug discovery and characterization. J Biomol Screen. 2001;6:83–90. - PubMed
    1. Edwards BS. Young SM. Saunders MJ. Bologa C. Oprea TI. Ye RD. Prossnitz ER. Graves SW. Sklar LA. High-throughput flow cytometry for drug discovery. Expert Opin Drug Discov. 2007;2:685–696. - PubMed
    1. Roman DL. Talbot JN. Roof RA. Sunahara RK. Traynor JR. Neubig RR. Identification of small-molecule inhibitors of RGS4 using a high-throughput flow cytometry protein interaction assay. Mol Pharmacol. 2007;71:169–175. - PubMed
    1. Simons PC. Shi M. Foutz T. Cimino DF. Lewis J. Buranda T. Lim W. Neubig RR. McIntire WE. Garrison J. Prossnitz E. Sklar LA. Ligand–receptor–G-protein molecular assemblies on beads for mechanistic studies and screening by flow cytometry. Mol Pharmacol. 2003;64:1227–1238. - PubMed

MeSH terms

LinkOut - more resources