. 2010 Dec 15;202(12):1866-76.
doi: 10.1086/657419. Epub 2010 Nov 4.

Comparative analysis of virulence and toxin expression of global community-associated methicillin-resistant Staphylococcus aureus strains

Affiliations

Comparative analysis of virulence and toxin expression of global community-associated methicillin-resistant Staphylococcus aureus strains

Min Li et al. J Infect Dis. .

Abstract

The current pandemic of community-associated methicillin-resistant Staphylococcus aureus (CA-MRSA) skin infections is caused by several genetically unrelated clones. Here, we analyzed virulence of globally occurring CA-MRSA strains in a rabbit skin infection model. We used rabbits because neutrophils from this animal species have relatively high sensitivity to Panton-Valentine leukocidin (PVL), a toxin epidemiologically correlated with many CA-MRSA infections. Virulence in the rabbit model correlated with in vitro neutrophil lysis and transcript levels of phenol-soluble modulin α and α-toxin, but not PVL genes. Furthermore, abscesses caused by USA300 and its PVL-negative progenitor USA500 were comparatively large and similar in size, suggesting that PVL has played a limited role in the evolution of USA300 virulence in the context of skin infections. Our study indicates a major but not exclusive impact of virulence on the epidemiological success of USA300 and other CA-MRSA strains and emphasizes the importance of core genome-encoded toxins in CA-MRSA skin infections.


Figures
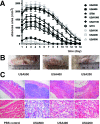
Figure 1
Figure 1
Rabbit abscess model. A, Abscess sizes (length × width) over the time of the experiment in global community-associated methicillinresistant Staphylococcus aureus (CA-MRSA) and hospital-associated methicillin-resistant Staphylococcus aureus (HA-MRSA) strains. Each rabbit (12 rabbits per bacterial strain) received 5×10⁸ colony-forming units (CFUs) at the right dorsum by intradermal injection. Filled symbols represent Panton- Valentine leukocidin (PVL)-positive, open symbols PVL-negative strains. Black symbols represent CA-MRSA strains, and gray symbols represent HAMRSA strains. Error bars show means ± standard error of the mean. B, Pictures of abscesses that developed in mice infected with the USA500, USA400, and USA200 strains. C, Histological examination of abscess tissue in mice infected with the USA500, USA400, and USA200 strains. B, C, Abscesses and degrees of neutrophil infiltration in strains ST80 and USA300 were similar to those observed in the USA500 strain. In strains USA1000, ST72, and USA100 these parameters were similar to those observed in USA400, and in strain USA1100 to those in strain USA200.
Figure 2
Figure 2
Cytokine concentrations in abscess tissue and blood. Concentrations of the cytokines TNF-α and interleukin 8 (IL-8) were measured by enzyme-linked immunosorbent assay (ELISA) in abscess and blood samples at day 4 after injection. Filled bars represent Panton-Valentine leukocidin (PVL)-positive, and open bars represent PVL-negative strains. Black bars represent community-associated methicillin-resistant Staphylococcus aureus (CA-MRSA), and gray bars represent hospital-associated methicillin-resistant Staphylococcus aureus strain. *P < .05; **P < .01; ***P < .001 (1-way analysis of variance [ANOVA], Dunnett's multiple comparison test versus USA300).
Figure 3
Figure 3
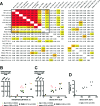
Correlation analyses. A, Correlation table showing 2-tailed P values calculated from raw data of each parameter using Pearson correlation analysis. If several measurements were available, mean values were calculated before correlation analysis. Cells are colored corresponding to the statistical significance values determined: P < .05, yellow;P < .01,orange;P < .001,red. 1, Correlation analysis for Panton-Valentine leukocidin (PVL) in tryptic soy broth (TSB) at 8 h was not possible, because no PVL was detectable in any sample. B, C, D, Graphical presentation of most important correlation analyses: B, Transcript levels versus neutrophil lysis. C, Transcript levels versus abscess size. D, Neutrophil lysis versus abscess size.
Figure 4
Figure 4
In vitro neutrophil lysis. In vitro lysis of human neutrophils after phagocytosis of S. aureus cells was determined by release of LDH. Filled bars represent Panton-Valentine leukocidin (PVL)-positive, open bars PVL-negative strains. Black bars represent community-associated methicillin- resistant Staphylococcus aureus (CA-MRSA) strain, and gray bars represent hospital-associated methicillin-resistant Staphylococcus aureus strain. *P < .05; ***P < .001 (1-way analysis of variance [ANOVA], Dunnett's multiple comparison test versus USA300).
Figure 5
Figure 5
In vitro toxin gene expression and agr activity. Expression of the hla (α-toxin), psmα, and lukS (Panton-Valentine leukocidin [PVL]) genes were measured by qRT-PCR of cultures grown to stationary growth phase (8 h) in tryptic soy broth (TSB). Activity of the agr system was measured by qRT-PCR of RNAIII under the same conditions. Black bars represent community-associated methicillin-resistant Staphylococcus aureus (CA-MRSA) strain, and gray bars represent hospital-associated methicillin-resistant Staphylococcus aureus strain. *P < .05 ; **P < .01; ***P < .001 (1-way analysis of variance [ANOVA], Dunnett's multiple comparison test versus USA300).
Figure 6
Figure 6
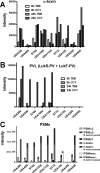
In vitro toxin expression (protein level). A, Analysis of a-toxin and Panton-Valentine leukocidin (PVL) levels in cultures grown for 8 and 24 h in tryptic soy broth (TSB) and casein hydrolysate and yeast-extract containing medium (CCY). Samples were analyzed by SDS-PAGE on 10% Tris/glycine gels and immunoblotting. Signal intensities were determined by densitometry. LukS-PV and LukF-PV were detected separately using specific antisera and signals achieved for LukS-PV and LukF-PV were added. B, Analysis of phenol-soluble modulin (PSM) production in TSB at 8 h of growth by RP-HPLC/ESI-MS. Values for selected PSMs (PSMα3, PSMβ1, δ-toxin, and the SCCmec-encoded PSMmec) are shown. PSM concentrations were also determined at 24 h of growth and in CCY (not shown). PSM concentrations were lower in CCY than in TSB, by a factor of ∼2, but relative PSM compositions were similar to those found in TSB. N-formylated and N-deformylated forms of PSMs were determined and are shown as clear and striped bar portions, respectively.
Table 1
Table 1
Strains Used in This Study

References

    1. Lowy FD. Staphylococcus aureus infections. N Engl J Med. 1998;339:520–532. - PubMed
    1. Lowy FD. Antimicrobial resistance: the example of Staphylococcus aureus. J Clin Invest. 2003;111:1265–1273. - PMC - PubMed
    1. Chambers HF, DeLeo FR. Waves of resistance: Staphylococcus aureus in the antibiotic era. Nat Rev Microbiol. 2009;7:629–641. - PMC - PubMed
    1. DeLeo FR, Otto M, Kreiswirth BN, Chambers HF. Community-associated meticillin-resistant Staphylococcus aureus. Lancet. 2010;375:1557–1568. - PMC - PubMed
    1. Daum RS, Ito T, Hiramatsu K, et al. A novel methicillin-resistance cassette in community-acquired methicillin-resistant Staphylococcus aureus isolates of diverse genetic backgrounds. J Infect Dis. 2002;186:1344–1347. - PubMed

Publication types

MeSH terms