. 2010;12(6):R205.
doi: 10.1186/ar3180. Epub 2010 Nov 4.

Enhanced angiogenic potency of monocytic endothelial progenitor cells in patients with systemic sclerosis

Affiliations

Enhanced angiogenic potency of monocytic endothelial progenitor cells in patients with systemic sclerosis

Yukie Yamaguchi et al. Arthritis Res Ther. 2010.

Abstract

Introduction: Microvasculopathy is one of the characteristic features in patients with systemic sclerosis (SSc), but underlying mechanisms still remain uncertain. In this study, we evaluated the potential involvement of monocytic endothelial progenitor cells (EPCs) in pathogenic processes of SSc vasculopathy, by determining their number and contribution to blood vessel formation through angiogenesis and vasculogenesis.

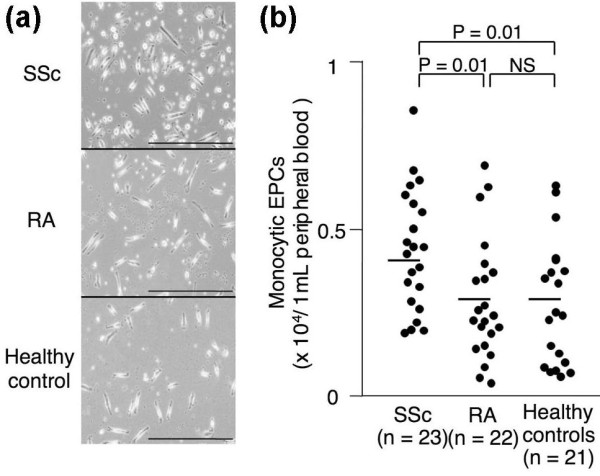
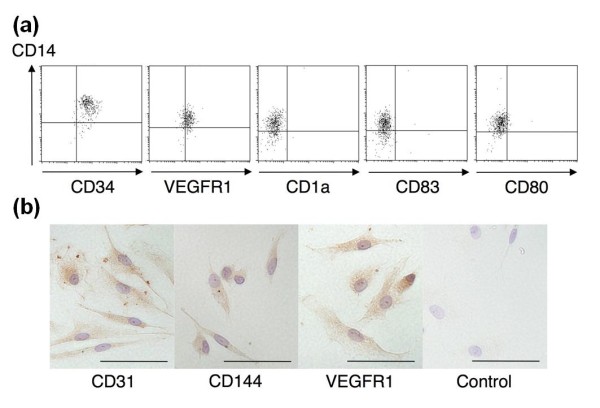
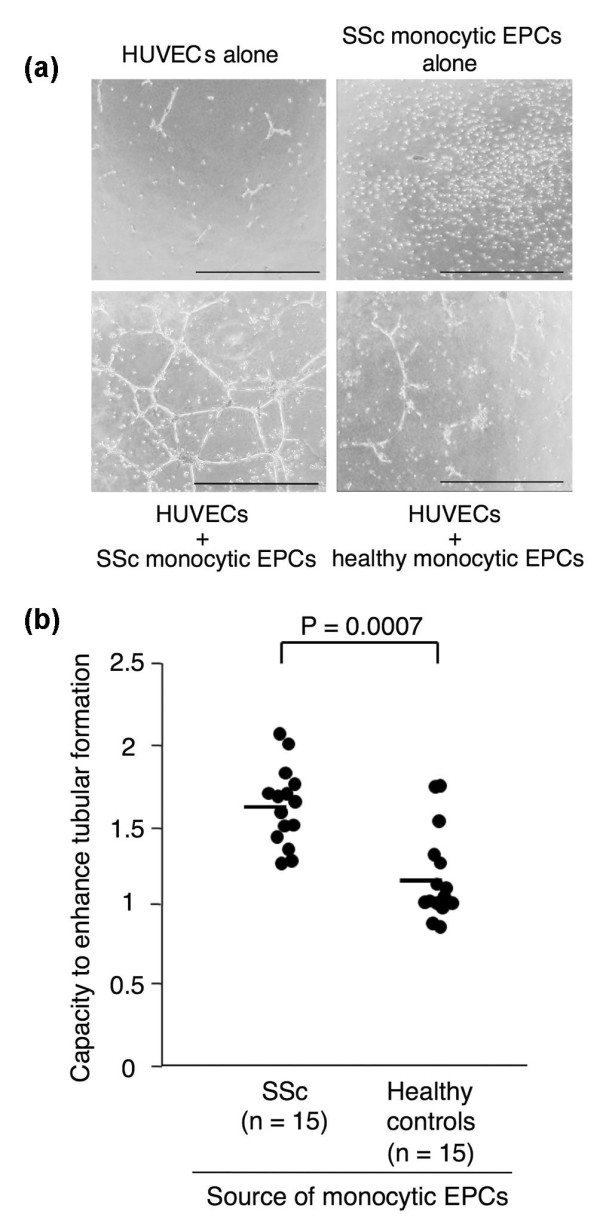
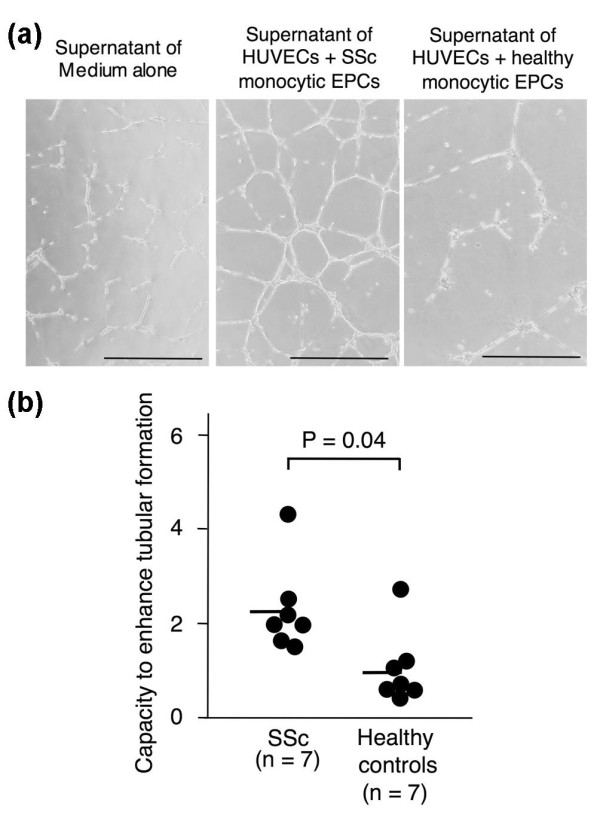
Methods: Monocytic EPCs were enriched and enumerated using a culture of peripheral blood mononuclear cells and platelets on fibronectin in 23 patients with SSc, 22 patients with rheumatoid arthritis (RA), and 21 healthy controls. To assess the capacity of monocytic EPCs to promote vascular formation and the contribution of vasculogenesis to this process, we used an in vitro co-culture system with human umbilical vein endothelial cells (HUVECs) on Matrigel® and an in vivo murine tumor neovascularization model.

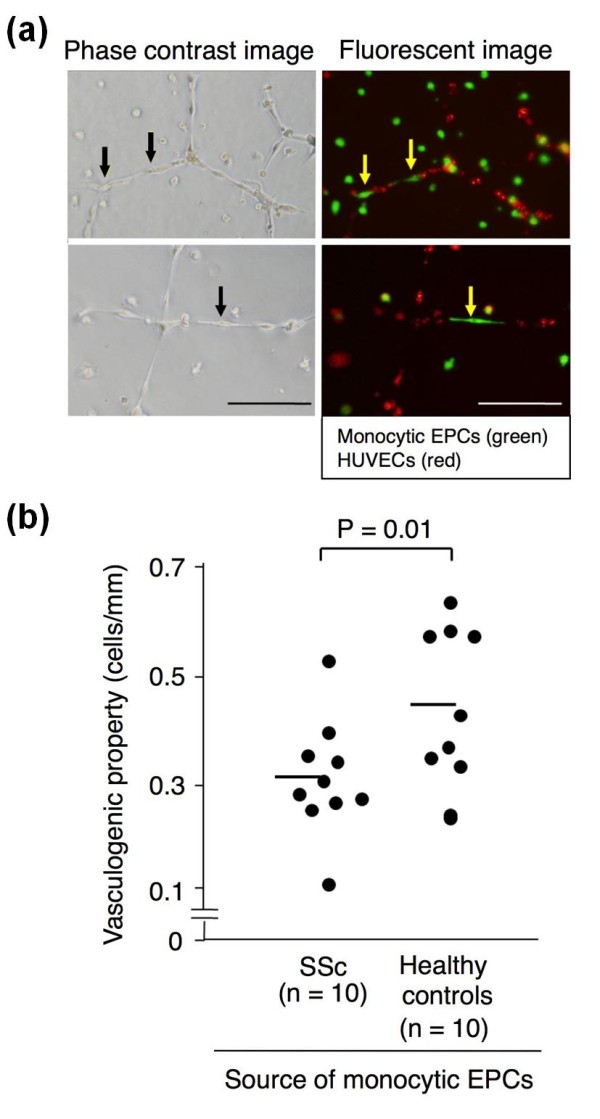
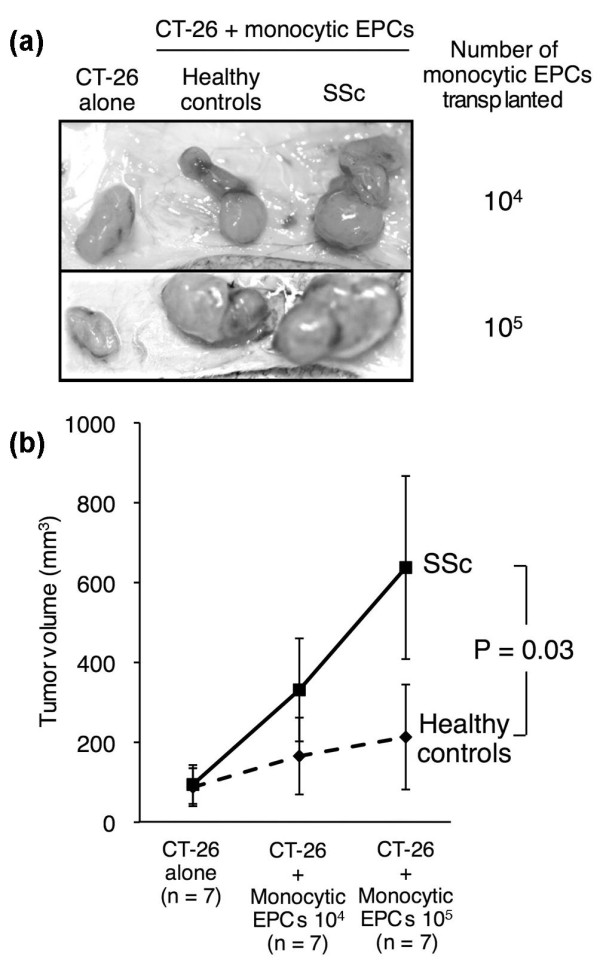
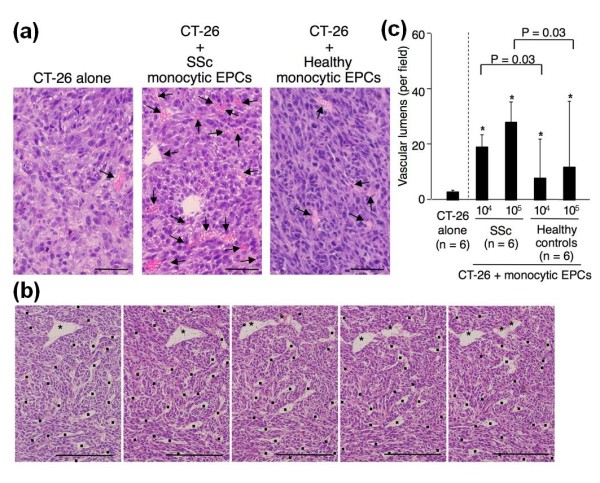
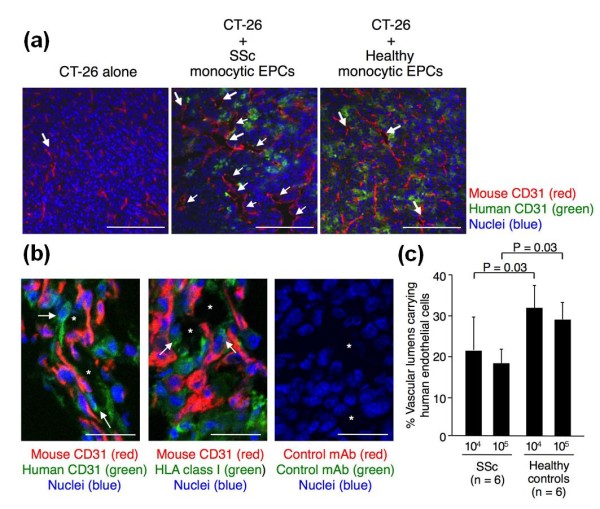
Results: Monocytic EPCs were significantly increased in SSc patients than in RA patients or healthy controls (P = 0.01 for both comparisons). Monocytic EPCs derived from SSc patients promoted tubular formation in Matrigel® cultures more than those from healthy controls (P = 0.007). Transplantation of monocytic EPCs into immunodeficient mice resulted in promotion of tumor growth and blood vessel formation, and these properties were more prominent in SSc than healthy monocytic EPCs (P = 0.03 for both comparisons). In contrast, incorporation of SSc monocytic EPCs into the tubular structure was less efficient in vitro and in vivo, compared with healthy monocytic EPCs.

Conclusions: SSc patients have high numbers of aberrant circulating monocytic EPCs that exert enhanced angiogenesis but are impaired in vasculogenesis. However, these cells apparently cannot overcome the anti-angiogenic environment that characterizes SSc-affected tissues.


Figures

Figure 1
Figure 1
Monocytic EPCs enriched in culture on fibronectin. (a) Representative images of monocytic EPCs cultured for 10 days, from an SSc patient, an RA patient, and a healthy control. Adherent cells with a typical spindle shape are regarded as monocytic EPCs. Scale bars = 500 mm. (b) Monocytic EPCs were quantified in SSc patients, RA patients, and healthy controls, and expressed as the number in 1 mL of peripheral blood. Horizontal bars indicate the mean values. NS, not significant.
Figure 2
Figure 2
Protein expression profiles of monocytic EPCs. (a) Flow cytometric analysis of monocytic EPCs derived from a healthy control. Cells were stained with anti-CD14 mAb plus mAb to CD34, VEGFR1, CD1a, CD83, or CD80, and analyzed by flow cytometry. (b) Immunohistochemical analysis of monocytic EPCs. Cells were stained with a mouse mAb to the endothelial marker, as indicated. Controls were incubated with an isotype-matched mouse mAb to an irrelevant antigen. Nuclei were counterstained with hematoxylin. Bars, 50 μm.
Figure 3
Figure 3
Capacity of monocytic EPCs to promote tubular formations in co-culture with HUVECs in Matrigel®. (a) Representative images of Matrigel® cultures of HUVECs (104) alone, monocytic EPCs (104) from an SSc patient alone, and HUVECs (104) plus monocytic EPCs (104) from an SSc patient and a healthy control. Scale bars = 1 mm. (b) Capacity of monocytic EPCs to enhance the tubular formation was expressed as the ratio of total tube length in the culture of HUVECs plus monocytic EPCs to the length in the culture of HUVECs alone, and compared between SSc patients and healthy controls. Horizontal bars indicate the mean values.
Figure 4
Figure 4
Capacity of monocytic EPC-derived conditioned medium to promote tubular formations in culture of HUVECs in Matrigel®. (a) Representative images of Matrigel® cultures of HUVECs in the presence of culture supernatants of HUVECs (104) alone, HUVECs (104) plus monocytic EPCs (104) from an SSc patient, and HUVECs (104) plus monocytic EPCs (104) from a healthy control. Scale bars = 500 μm. (b) Capacity to enhance tubular formation was expressed as the ratio of total tube length in the culture with conditioned medium of HUVECs plus monocytic EPCs to the length in the culture with conditioned medium of HUVECs alone, and compared between SSc patients and healthy controls. Horizontal bars indicate the mean values.
Figure 5
Figure 5
In vitro vasculogenic property of monocytic EPCs in Matrigel® culture. Monocytic EPCs labeled with PKH67 (green) and HUVECs labeled with Dil-acetylated LDL (red) were cultured together on Matrigel®. (a) Typical phase-contrast (left) and fluorescent (right) images of the same field of monocytic EPCs from an SSc patient (upper) and a healthy control (lower). An arrow indicates a monocytic EPC-derived cell incorporated into the tubular structure. Scale bars = 100 μm. (b) The vasculogenic property of monocytic EPCs was calculated as the number of monocytic EPCs within the tubular structure divided by the total tube length (cells/mm), and compared between SSc patients and healthy controls. Horizontal bars indicate the mean values.
Figure 6
Figure 6
Tumor growth after transplantation of monocytic EPCs in the in vivo tumor neovascularization model. Tumors from colon carcinoma CT-26 cells injected subcutaneously into the back of mice alone or in combination with monocytic EPCs (104 or 105) derived from SSc patients or healthy controls. Tumor growth was assessed 10 days later. (a) Representative subcutaneous tumors from mice that received transplanted CT-26 cells alone, or CT-26 cells along with monocytic EPCs (104 or 105) from a healthy control or an SSc patient. (b) Tumor volumes in mice that received transplants of CT-26 cells alone, or CT-26 cells in combination with monocytic EPCs from SSc patients or healthy controls (104 or 105). Results are shown as the mean and standard deviation.
Figure 7
Figure 7
Capacity of monocytic EPCs to promote the formation of blood vessels in a tumor neovascularization model. (a) Representative tumor sections stained with hematoxylin and eosin, from mice with transplants of CT-26 cells alone or of CT-26 cells and monocytic EPCs from an SSc patient or a healthy control. Arrows indicate blood vessels carrying erythrocytes. Scale bars = 200 μm. (b) Representative consecutive sections of the tumor stained with hematoxylin and eosin, from mice with transplants of CT-26 cells and monocytic EPCs from an SSc patient. Asterisks indicate a relatively large blood vessel found in all consecutive sections. Dots indicate other blood vessels carrying erythrocytes. Scale bars = 500 μm. (c) Vascular lumen density in tumors that arose from transplanted CT-26 cells alone or CT-26 cells with monocytic EPCs (104 or 105) from SSc patients or healthy controls.
Figure 8
Figure 8
Incorporation of monocytic EPCs into vascular lumen in vivo in a tumor neovascularization model. (a) Representative tumor sections stained for mouse CD31 (red) and human CD31 (green), from mice with transplants of CT-26 cells alone or of CT-26 cells and monocytic EPCs from an SSc patient or a healthy control. Nuclei were counterstained with TO-PRO3 (blue). Arrows indicate blood vessels. Scale bars = 200 μm. (b) Representative tumor sections stained for mouse CD31 (red) and human CD31 or HLA class I (green) from mice with transplants of CT-26 cells and monocytic EPCs from a healthy control. Negative controls were sections incubated with isotype-matched mouse or rat mAb to an irrelevant antigen, instead of the primary antibody. Nuclei were counterstained with TO-PRO3 (blue). Asterisks indicate blood vessel lumen, while arrows indicate transplanted human monocytic EPCs located at the vascular wall. Scale bars = 50 μm. (c) The vasculogenic potency of monocytic EPCs was assessed by determining the proportion of vascular lumens carrying human CD31+ endothelial cells in tumors arising from CT-26 cells co-transplanted with monocytic EPCs (104 or 105) from SSc patients or healthy controls.

Similar articles

Cited by

References

    1. LeRoy EC. Systemic sclerosis: a vascular perspective. Rheum Dis Clin North Am. 1996;22:675–694. doi: 10.1016/S0889-857X(05)70295-7. - DOI - PubMed
    1. Herrick AL. Pathogenesis of Raynaud's phenomenon. Rheumatology (Oxford) 2005;44:587–596. doi: 10.1093/rheumatology/keh552. - DOI - PubMed
    1. Guiducci S, Giacomelli R, Matucci-Cerinic M. Vascular complications of scleroderma. Autoimmun Rev. 2007;6:520–523. doi: 10.1016/j.autrev.2006.12.006. - DOI - PubMed
    1. Distler JH, Gay S, Distler O. Angiogenesis and vasculogenesis in systemic sclerosis. Rheumatology (Oxford) 2006;45(Suppl 3):iii26–27. doi: 10.1093/rheumatology/kel295. - DOI - PubMed
    1. Isner JM, Asahara T. Angiogenesis and vasculogenesis as therapeutic strategies for postnatal neovascularization. J Clin Invest. 1999;103:1231–1236. doi: 10.1172/JCI6889. - DOI - PMC - PubMed

Publication types