. 2010 Nov 4:10:602.
doi: 10.1186/1471-2407-10-602.

Antiproliferative and pro-apoptotic effects afforded by novel Src-kinase inhibitors in human neuroblastoma cells

Affiliations

Antiproliferative and pro-apoptotic effects afforded by novel Src-kinase inhibitors in human neuroblastoma cells

Michele Navarra et al. BMC Cancer. .

Abstract

Background: Neuroblastoma (NB) is the second most common solid malignancy of childhood that usually undergoes rapid progression with a poor prognosis upon metastasis. The Src-family tyrosine kinases (SFKs) are a group of proteins involved in cancer development and invasiveness that seem to play an important role in the NB carcinogenesis.

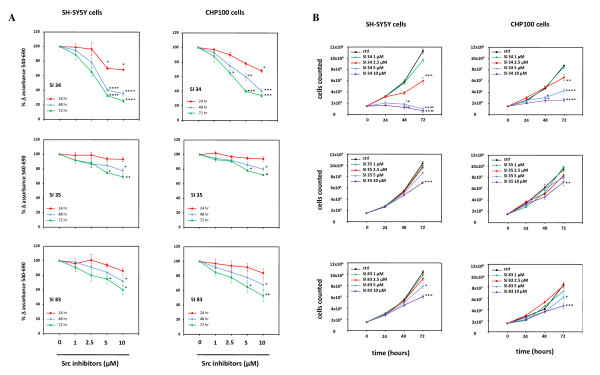
Methods: To determine cell proliferation, the growth rate was evaluated by both MTT test and cells counted. Analysis of DNA content was performed for the evaluation of the cell cycle and apoptosis. To characterize the mechanisms underlying the antiproliferative effects induced by SI 34, a novel pyrazolo-pyrimidine derivative provided with Src inhibitory activity, the involvement of some cellular pathways that are important for cell proliferation and survival was investigated by western blot assays. In particular, the contribution of cyclins, Src and ERK were examined. Finally, experiments of cell adhesion and invasiveness were performed.

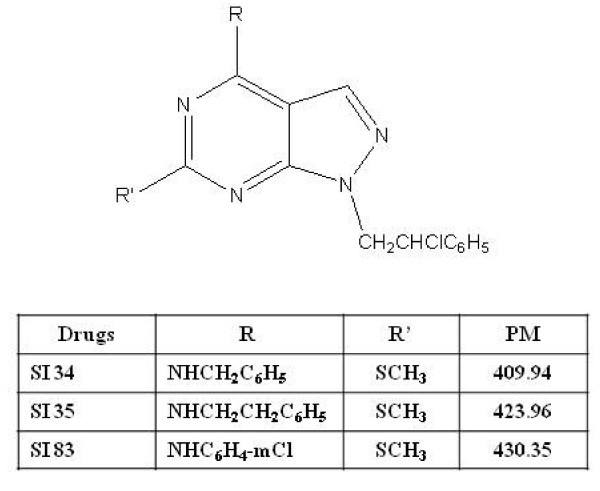
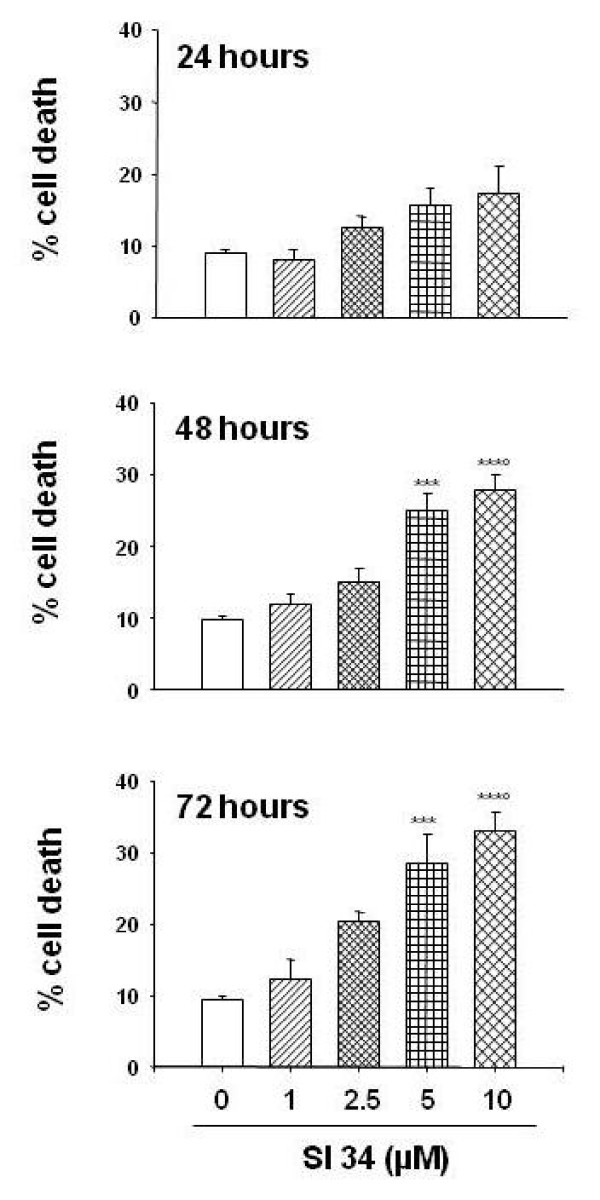
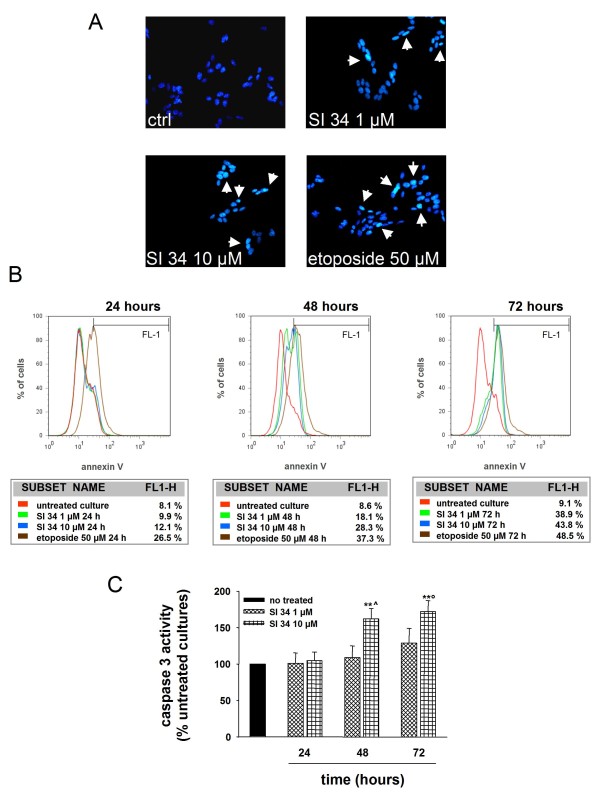
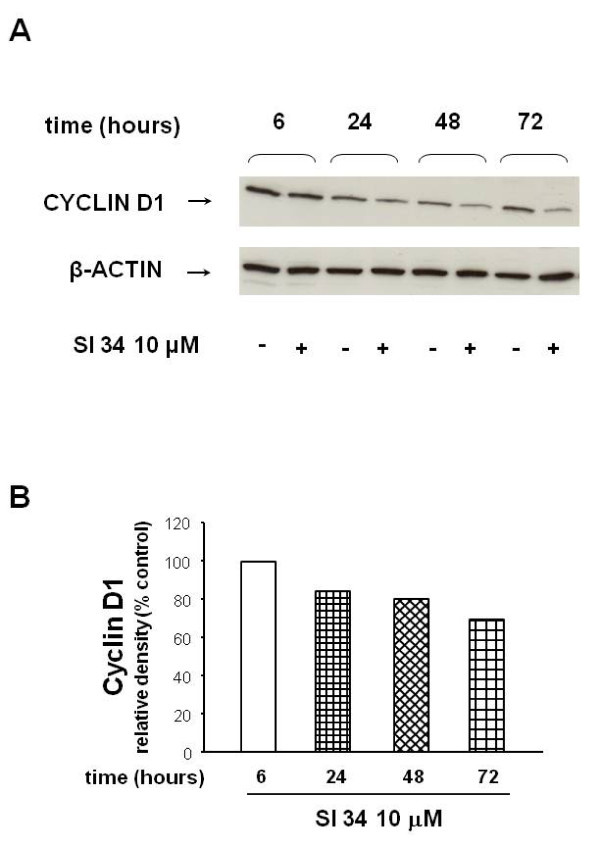
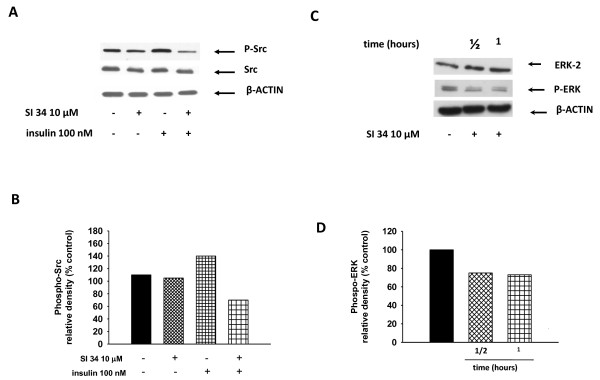
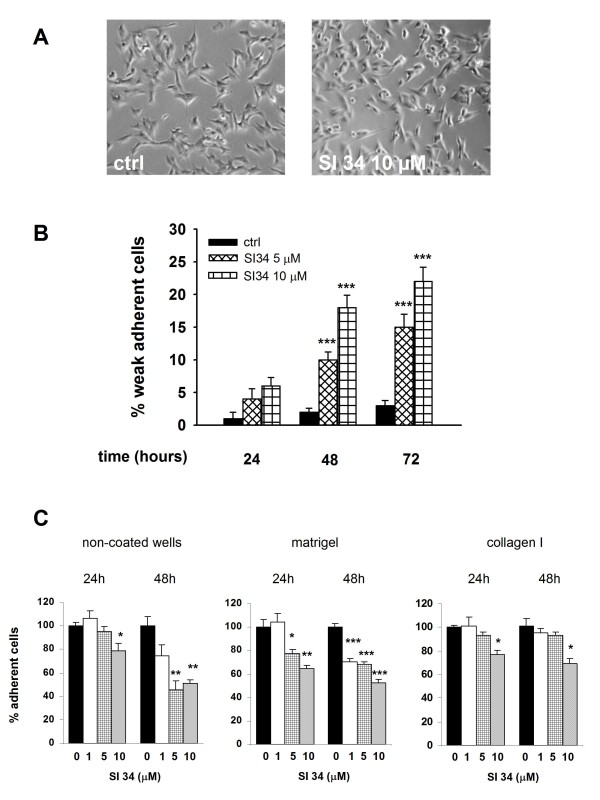
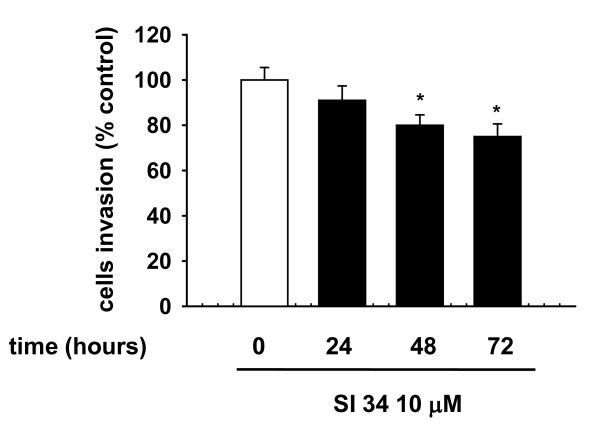
Results: Treatment of SH-SY5Y human NB cells and CHP100 human neuroepithelioma (NE) cultures with three novel pyrazolo[3,4-d]pyrimidine derivatives, namely SI 34, SI 35 and SI 83, inhibits the cell proliferation in a time and concentration-dependent manner. The maximal effect was obtained after 72 hours incubation with SI 34 10 μM. Fluorescence microscopy experiments, flow cytometry analysis and determination of caspase-3 activity by fluorimetric assays showed that SI 34 induced SH-SY5Y apoptosis. Moreover, SI 34 determined cell cycle arrest at the G0/G1 phase, paralleled by a decreased expression of cyclin D1. Furthermore, our data indicate that SI 34 reduces the SH-SY5Y cells adhesion and invasiveness. Evidence that SI 34 inhibits the Src and the ERK-phosphorylation, suggests the mechanism through which it exerts its effects in SH-SY5Y cells.

Conclusions: Our study shows the ability of this pyrazolo-pyrimidine Src inhibitor in reducing the growth and the invasiveness of human NB cells, suggesting a promising role as novel drug in the treatment of neuroblastoma.


Figures

Figure 1
Figure 1
Chemical structure of the pyrazolopyrimidine derivatives used in this study.
Figure 2
Figure 2
SI derivatives inhibit SH-SY5Y and CHP100 cell growth. Both SH-SY5Y and CHP100 cells were exposed to increasing concentration of SI 34 compounds for the indicated periods of time. Proliferation rate was assessed by MTT assay (A) and cell counting (B). Results of MTT test are expressed as percentages of the values detected in untreated cells. Each value is the mean ± S.E.M. of at least three experiments performed in eightplicate (MTT test) or in triplicate (cell counting). *, ** and ***P < 0.05, P < 0.01 and P < 0.001 vs control and SI 34 1 μM; °P < 0.05 vs SI 34 2.5 μM.
Figure 3
Figure 3
Cytotoxic effects induced by SI 34 on SH-SY5Y cells. Cytotoxic effect induced by SI 34 (1-10 μM; 24-72 hours) was evaluated in terms of cell death assessed by trypan blue staining exclusion assay. Data, expressed as mean ± S.E.M., represent the values obtained in three different sets of experiments made in triplicate. ***P < 0.001 vs control and SI 34 1 μM; °P < 0.01 vs SI 34 2.5 μM.
Figure 4
Figure 4
Evaluation of apoptosis induced by SI 34 on SH-SY5Y cells. (A) Morphological analysis of nuclear chromatin in SH-SY5Y cells stained with the DNA-binding fluorochrome Hoechst 33258. Cells with morphological changes in the nuclei or condensed chromatin were defined as apoptotic cells. Arrows point the intense nuclear fluorescence present in some cells exposed to both SI 34 (1 and 10 μM) or etoposide (50 μM). Nuclei were visualized by fluorescence microscopy at a magnification of 200×. A representative experiment that was replicated three times with similar results is shown. (B) Annexin V (FITC) staining assay. SH-SY5Y cells undergoing apoptosis were detected by cytofluorimetric analysis as described in materials and methods. Values reported depicted the percentage of events within the gate FL1 used to define AnV+ cells. The red line represents the untreated culture. The green and blue lines symbolize the cells incubated with SI 34 1 and 10 μM, respectively. The brown curve embodies SH-SY5Y cells exposed to etoposide 50 μM as inducer of apoptosis. The FACS analysis shown is representative of three different experiments. (C) Caspase-3 activity assay performed as described in the materials and methods. Results are expressed as percentage of relative fluorescence units (RFU) per min per mg of protein detected in untreated cultures, which are arbitrarily expressed as 100%. Each value represents the mean ± S.E.M of three sets of experiments performed in triplicate. **P < 0.01 vs respective control; ^P < 0.01 vs 48 hours SI 34 1 μM; °P < 0.05 vs 72 hours SI 34 1 μM.
Figure 5
Figure 5
Analysis of cyclin D1 expression in SH-SY5Y treated with SI 34. (A) Immunoblot of SH-SY5Y cells exposed to 10 μM SI 34 for 6-72 hours: a representative of three separate experiments is shown. (B) Quantification of cyclin D1 expression from blots in panels A achieved with ImageJ software. Histogram shows the results of the densitometric analysis of autoradiographic bands in which the protein levels were normalized for β-actin (black bars for the untreated cultures and white bars for the cells exposed to SI 34 10 μM for the indicated times). Levels are extrapolated as percentages of the values detected in control cells, which are arbitrarily assigned as 100%.
Figure 6
Figure 6
Src- and ERK-phosphorylation in SH-SY5Y treated with SI 34. (A) SH-SY5Y cells were stimulated with insulin (100 nM; 30 min) in the presence or absence of SI 34 (10 μM; 30 min), and then western blotting analysis of Src and phospho-Src was performed. A Western blot, representative of three independent experiments showing similar results, is presented. (C) A representative gel (out of three) showed the ERK and phospho-ERK expression in presence or not of SI 34 is illustrated. (B and D) Densitometric analysis of immunoreactive bands corresponding to the Src-phosphorylated and ERK phosphorylated forms from blots A and C are reported. Autoradiographic bands were quantified by ImageJ software and normalized for β-actin levels. Data are reported as percentages of the values detected in untreated cultures.
Figure 7
Figure 7
SI 34 decreases SH-SY5Y cell adhesion. (A) Changes of cellular morphology in SH-SY5Y cultures exposed to 10 μM SI 34 for 72 hours. (B) Detached cells from cultures exposed (white bars) or not (black bars) to SI 34 were collected and counted as described in materials and methods. The results are expressed as percentage of detached cells (subtracted the percentage of dead cells from the full amount of detached cells) with respect to the total number of cells present in the well. Each value is the mean ± S.E.M. of 6 different sets of experiments made in triplicate. ***P < 0.001 vs respective controls. (C) Adhesion assay performed by plating SH-SY5Y cells on two different physiological substrates (Matrigel and collagen I) and on non-coated plastic surface for 30 min. Cells were treated with increasing concentrations of SI 34 (0, 1, 5, 10 μM) for 24 or 48 hours prior the adhesion assay. The values are expressed as mean percentage with respect to control (black bar) of at least three different measurements (± S.E.M). *, ** and ***P < 0.05, P < 0.01 and P < 0.001 vs respective control.
Figure 8
Figure 8
Reduction of SH-SY5Y invasiveness by SI 34. Cells treated (filled bar) or not (empty bar) with SI 34 10 μM migrating through the filter of a matrigel Invasion chambers. Data are reported as percentages of cells counted in untreated cultures. Each value represents the mean ± S.E.M. of 3 sets of experiments performed in triplicate. *P < 0.05 vs respective controls.

Similar articles

Cited by

References

    1. Brodeur GM. Neuroblastoma: biological insights into a clinical enigma. Nat Rev Cancer. 2003;3:203–216. doi: 10.1038/nrc1014. - DOI - PubMed
    1. Maris JM, Hogarty MD, Bagatell R, Cohn SL. Neuroblastoma. Lancet. 2007;369:2106–2120. doi: 10.1016/S0140-6736(07)60983-0. - DOI - PubMed
    1. Levitzki A. Tyrosine kinases as targets for cancer therapy. Eur J Cancer. 2002;38(Suppl 5):S11–18. doi: 10.1016/S0959-8049(02)80598-6. - DOI - PubMed
    1. Krause DS, Van Etten RA. Tyrosine Kinases as Targets for Cancer Therapy. N Engl J Med. 2005;353:172–187. doi: 10.1056/NEJMra044389. - DOI - PubMed
    1. Arora A, Scholar EM. Role of Tyrosine Kinase Inhibitors in Cancer Therapy. JPE. 2005;315:971–979. doi: 10.1124/jpet.105.084145. - DOI - PubMed

Publication types

Substances