

CT angiographic source images: flow- or volume-weighted?
- PMID: 21051518
- PMCID: PMC7965723
- DOI: 10.3174/ajnr.A2282
CT angiographic source images: flow- or volume-weighted?
Abstract
Background and purpose: CTA-SI have been previously reported to correlate with CBV. We hypothesized that CTA-SI performed by modern multisection CT scanners are CBF-, not CBV-weighted.
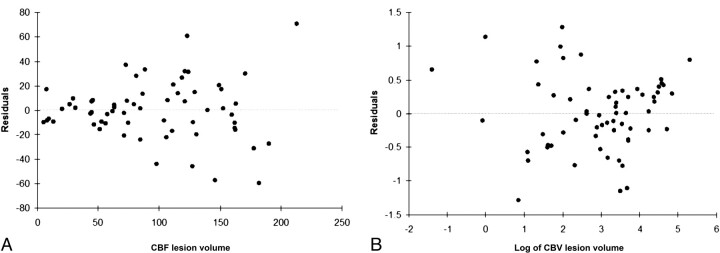
Materials and methods: Sixty-four consecutive patients with anterior circulation stroke symptoms were selected from a stroke data base between June 2007 and January 2009. Two independent blinded readers calculated defect volumes of CTA-SI and PCCT, CBF, and CBV images. Spearman correlation of lesion volumes was performed. Linear regression and residual analysis demonstrated factors associated with outliers for CTA or PCCT for CBF and CBV volumes.
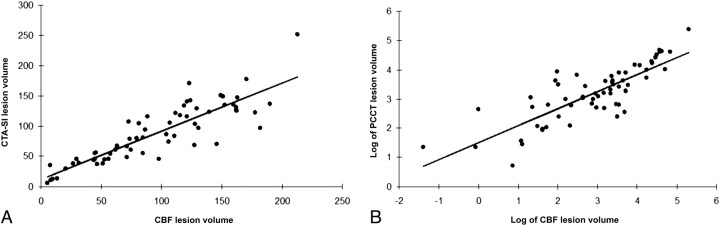
Results: We found a strong positive correlation between CTA with CBF (r = 0.89, P < .0001) and between PCCT and CBV (r = 0.79, P < .0001). CTA to CBV (r = 0.5, P < .0001) and PCCT to CBF (r = 0.52, P < .0001) correlations were weaker. Positive CTA outliers had lower ASPECTS (P = .01), larger baseline CTA (149 ± 46 cm(3) versus 83 ± 32 cm(3); P = .002, respectively), and final infarct (190 ± 100 cm(3) versus 80 ± 50 cm(3); P = .09, respectively) volumes than nonoutliers. No baseline features were significantly related to PCCT outliers. There was no difference in the vessel occlusion sites for positive or negative outliers for CTA or PCCT (P = .55 and P = 1.00, respectively).
Conclusions: Our results indicate that CTA-SI are CBF- rather than CBV-weighted.
Figures
Comment in
-
CT angiographic source images with modern multisection CT scanners: appropriate injection protocol is crucial.AJNR Am J Neuroradiol. 2011 May;32(5):E93; author reply E94. doi: 10.3174/ajnr.A2493. Epub 2011 Apr 7. AJNR Am J Neuroradiol. 2011. PMID: 21474630 Free PMC article. No abstract available.
-
CT angiography source images with modern multisection CT scanners: delay time from contrast injection to imaging determines correlation with infarct core.AJNR Am J Neuroradiol. 2012 Apr;33(4):E61; author reply E62. doi: 10.3174/ajnr.A3039. Epub 2012 Feb 9. AJNR Am J Neuroradiol. 2012. PMID: 22322617 Free PMC article. No abstract available.
References
-
- Parsons MW, Pepper EM, Chan V, et al. . Perfusion computed tomography: prediction of final infarct extent and stroke outcome. Ann Neurol 2005;58:672–79 - PubMed
-
- Demchuk AM, Hill MD, Barber PA, et al. . Importance of early ischemic computed tomography changes using ASPECTS in NINDS rtPA Stroke Study. Stroke 2005;36:2110–15. Epub 2005 Sep 15 - PubMed
-
- Dzialowski I, Hill MD, Coutts SB, et al. . Extent of early ischemic changes on computed tomography (CT) before thrombolysis: prognostic value of the Alberta Stroke Program Early CT Score in ECASS II. Stroke 2006;37:973–78 - PubMed
-
- Schramm P, Schellinger PD, Fiebach JB, et al. . Comparison of CT and CT angiography source images with diffusion-weighted imaging in patients with acute stroke within 6 hours after onset. Stroke 2002;33:2426–32 - PubMed
Publication types
MeSH terms
LinkOut - more resources
Full Text Sources
Medical