. 2011 Jan 21;286(3):2245-60.
doi: 10.1074/jbc.M110.192468. Epub 2010 Nov 4.

Identification and characterization of a novel-type ferric siderophore reductase from a gram-positive extremophile

Affiliations

Identification and characterization of a novel-type ferric siderophore reductase from a gram-positive extremophile

Marcus Miethke et al. J Biol Chem. .

Abstract

Iron limitation is one major constraint of microbial life, and a plethora of microbes use siderophores for high affinity iron acquisition. Because specific enzymes for reductive iron release in gram-positives are not known, we searched Firmicute genomes and found a novel association pattern of putative ferric siderophore reductases and uptake genes. The reductase from the schizokinen-producing alkaliphile Bacillus halodurans was found to cluster with a ferric citrate-hydroxamate uptake system and to catalyze iron release efficiently from Fe[III]-dicitrate, Fe[III]-schizokinen, Fe[III]-aerobactin, and ferrichrome. The gene was hence named fchR for ferric citrate and hydroxamate reductase. The tightly bound [2Fe-2S] cofactor of FchR was identified by UV-visible, EPR, CD spectroscopy, and mass spectrometry. Iron release kinetics were determined with several substrates by using ferredoxin as electron donor. Catalytic efficiencies were strongly enhanced in the presence of an iron-sulfur scaffold protein scavenging the released ferrous iron. Competitive inhibition of FchR was observed with Ga(III)-charged siderophores with K(i) values in the micromolar range. The principal catalytic mechanism was found to couple increasing K(m) and K(D) values of substrate binding with increasing k(cat) values, resulting in high catalytic efficiencies over a wide redox range. Physiologically, a chromosomal fchR deletion led to strongly impaired growth during iron limitation even in the presence of ferric siderophores. Inductively coupled plasma-MS analysis of ΔfchR revealed intracellular iron accumulation, indicating that the ferric substrates were not efficiently metabolized. We further show that FchR can be efficiently inhibited by redox-inert siderophore mimics in vivo, suggesting that substrate-specific ferric siderophore reductases may present future targets for microbial pathogen control.


Figures

FIGURE 1.
FIGURE 1.
A, global ClustalW alignment (identical and similar amino acids shown black and gray shaded boxes, respectively) of putative ferric siderophore reductases with C-terminally conserved cysteine motifs (highlighted in orange) from five Firmicute species (Gsp, Geobacillus sp. WCH70; Afl, Anoxybacillus flavithermus WK1; Bli, Bacillus licheniformis ATCC14580; Bme, B. megaterium DSM319; Bha, B. halodurans C-125) and five Enterobacteriaceae (Cro, Citrobacter rodentium ICC168; Sen, Salmonella enterica subsp. enterica SPB7; Sso, Shigella sonnei Ss046; Eco, E. coli K-12; Kpn, Klebsiella pneumoniae 342). Predicted transmembrane regions in the FhuF-type reductases are indicated by red-coded box. B, association of ferric siderophore ATP-binding cassette-type uptake genes and putative reductases in Firmicute species. Blue, substrate binding genes; yellow, permease genes; green, ATPase genes; red, reductase genes. Nomenclature for B. licheniformis and B. megaterium genes was taken from homologs of the B. subtilis ferric hydroxamate transporter yfiY-yfiZyfhA-yusV (51). C, phylogenetic clustering of reductase sequences aligned in A. Theoretical evolutionary rates of nucleotide substitutions resulting in sequence diversity by assuming one common ancestor are indicated. D, upper panel, predicted gene cluster for schizokinen biosynthesis (black arrows) and export (gray arrow) from B. megaterium QM B1551 and B. halodurans C-125 with given GenBankTM locus tags and percentages of amino acid sequence identities. Predicted gene functions are as follows: BMQ_4069/BH2624 (S. meliloti RhbA homologs), 2,4-diaminobutyrate 4-transaminase; BMQ_4068/BH2623 (RhbB homologs), l-2,4-diaminobutyrate decarboxylase; BMQ_4067/BH2622 (RhbC homologs); type A siderophore synthetase; BMQ_4066/BH2621 (RhbD homologs), acyl-CoA transferase; BMQ_4065/BH2620 (RhbE homologs), type B siderophore synthetase; BMQ_4064/BH2619, major facilitator superfamily-type transporter; BMQ_4063/BH2618 (RhbF homologs), type C siderophore synthetase. Lower panel, electrospray ionization-MS positive ion mode spectrum of extracted schizokinen from B. halodurans iron-deprived culture medium. Mass peaks are as follows: 403.1 = [M − H2O + H]+; 421.4 = [M + H]+; 424.9 = [M − H2O + Na]+; 443.2 = [M + Na]+; 456.2 = [M − H2O + Fe − 2H]+; 459.1 = [M + K]+; 473.9 = [M + Fe − 2H]+.
FIGURE 2.
FIGURE 2.
Cofactor characterization, iron-dependent regulation, and cellular localization of BH1040 (FchR). A, UV-visible analysis of FchR (35 μm) after aerobic purification and dithionite reduction; inset, SDS-PAGE analysis of purified protein. B, mass spectrometric analysis of aerobically purified FchR with recombinant Strep-tag II showing the mass of apo-FchR-Strep-tag II (32,585 atomic mass units) and holo-FchR-Strep-tag II (32,759 atomic mass units) carrying a [2Fe-2S] cofactor. C, analytical gel filtration using a Zorbax GF-250 column with 100 μg of FchR and calibration proteins; F, ferritin; A, aldolase; C, conalbumin; O, ovalbumin; CA, carbonic anhydrase; AP, aprotinin. D, Western analysis with FchR polyclonal antibodies. Lane 1, marker; lane 2, recombinantly purified FchR; lane 3, B. halodurans cytosolic protein extract; lane 4, B. halodurans ΔfchR cytosolic protein extract (50 μm BP/50 mm Phen); lane 5, B. halodurans cytosolic protein extract (5 μm BP/5 μm Phen); lane 6, B. halodurans cytosolic protein extract (50 μm BP/50 μm Phen); lane 7, B. halodurans membrane fraction; lane 8, B. halodurans membrane fraction (50 μm BP/50 μm Phen).
FIGURE 3.
FIGURE 3.
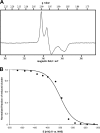
EPR analysis of BH1040 (FchR) Fe/S cofactor and EPR redox titration. A, EPR spectrum of dithionite-reduced FchR measured at 40 K with 9.4681 GHz microwave frequency, 0.2 milliwatt microwave power, 100 kHz modulation frequency, and 1.25 mT modulation amplitude. Found g values are as follows: gz = 2.001; gy = 1.956; gx = 1.866. B, normalized Nernst plot of EPR amplitude change (based on the 1.956 EPR feature) obtained from redox titration with dithionite showing a midpoint potential of −348.4 mV (versus NHE). Spectra were obtained at 77 K with 9.4681 GHz microwave frequency, 5.0 milliwatt microwave power, 100 kHz modulation frequency, and 1.25 mT modulation amplitude.
FIGURE 4.
FIGURE 4.
A, qualitative estimation of substrate spectrum of FchR by incubation of 50 μm reduced and purified enzyme with 150 μm of potential ferric siderophore substrates for 10 min at pH 8.0. UV-visible spectra were measured before and after incubation to monitor Fe/S cluster reoxidation. B, fluorescence titration of BH1037 applied at a concentration of 3 μm was performed with Fe(III)-dicitrate, ferrichrome, Fe(III)-schizokinen, and Fe(III)-aerobactin. Quenching curves obtained with Fe(III)-schizokinen and Fe(III)-aerobactin upon excitation of protein tyrosine/tryptophan fluorescence at 280 nm, and emission of fluorescence at 340 nm were fitted according to the law of mass action by using a 1:1 stoichiometric binding model. C, scheme of electron donor/recycling system coupled with FchR-dependent activity for kinetic analysis of iron release (upper panel). Applied starting concentrations were 2 mm glucose 6-phosphate, 2 mm NADPH, and 10 milliunits of regenerative enzymes ferredoxin:NADP+ reductase and glucose-6-phosphate dehydrogenase. After 10 min of equilibration, transfer rates for nonlimiting electron shuttling in the presence of varying concentrations of ferricyanide as terminal acceptor were determined at pH 8.0 (lower panel). Data of three independent determinations were averaged, plotted with standard deviations, and analyzed by Michaelis-Menten kinetic. D, iron release kinetics with different ferric siderophore substrates and pre-equilibrated 1 μm FchR, 10 μm Fd, and electron donor/recycling system as indicated in C. Release activity was monitored by determination of Fe(II)-ferene absorbance at 590 nm. Amounts of released Fe(II) per time were calculated using a Fe(II)-ferene spectral calibration curve, and background activity was subtracted for each measurement by performing control reactions without FchR. Data of three independent determinations for each substrate were averaged, plotted with corresponding standard deviations, and fitted according to the Michaelis-Menten model.
FIGURE 5.
FIGURE 5.
Inhibition studies with Ga(III)-charged redox-inert substrate mimics. By applying the standard kinetic conditions, inhibition assays were performed with Fe(III)-dicitrate as FchR substrate and Ga(III)-dicitrate (A) and Ga(III)-desferrioxamine E (B) as potential inhibitors. To determine inhibition constants, different Fe(III)-dicitrate concentrations were chosen (50, 100, 200, and 400 μm), and concentrations of the inhibitors were varied from 0 to 70 μm in case of Ga(III)-dicitrate and 0 to 12.5 μm in case of Ga(III)-desferrioxamine E. Three independent measurements for each concentration were performed; data were averaged and plotted with their standard deviations according to the Dixon plot method. Ki values were determined from corresponding curve intersections of the plotted diagrams.
FIGURE 6.
FIGURE 6.
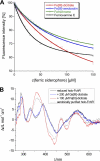
A, fluorescence titrations with oxidized (catalytically inactive) holo-FchR and various ferric siderophore substrates. Concentrations of 50 μm FchR were used for titration with Fe(III)-dicitrate, Fe(III)-aerobactin, and ferrichrome, and 20 μm FchR were used for titration with ferrioxamine E. Quenching curves obtained after tyrosine/tryptophan excitation at 280 nm by fluorescence emission at 340 nm were fitted to the law of mass action by assuming 1:1 stoichiometric binding. B, CD analysis of the [2Fe-2S] cluster spectrum of holo-FchR, either after aerobic purification or after quantitative reduction of the enzyme. Additionally, Ga(III)-dicitrate and Fe(III)-dicitrate were sequentially added to reduced holo-FchR under anaerobic conditions after each measurement to compare spectral changes upon redox-inert and redox-active substrate interaction.
FIGURE 7.
FIGURE 7.
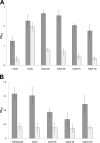
Growth analysis of B. halodurans WT (dark gray bars) and ΔfchR (light gray bars) in defined minimal medium supplemented with redox-active or redox-inert FchR substrates. A, cells were grown in iron-limited minimal medium without addition of iron (−Fe(III)) or with addition of either 100 μm FeCl3 (Fe(III)), Fe(III)-dicitrate (Fe(III)-DC), Fe(III)-aerobactin (Fe(III)-AB), ferrichrome (Fe(III)-FC), or ferrioxamine E (Fe(III)-FO). Absorbances (A600) of stationary cultures were monitored from three independent growth experiments, and averaged data were plotted with corresponding standard deviations. B, cells were grown in modified iron-limited Belitsky minimal medium without addition of iron or gallium (−Fe(III)/Ga(III)) or with addition of either 100 μm GaCl3 (Ga(III)), Ga(III)-dicitrate (Ga(III)-DC), Ga(III)-aerobactin (Ga(III)-AB), or Ga(III)-desferrioxamine E (Ga(III)-DFO). Cultures of three independent growth experiments each were grown to stationary phase, and averaged absorbances (A600) were plotted with corresponding standard deviations.
FIGURE 8.
FIGURE 8.
Current model of cytosolic iron release systems in Gram-positive and Gram-negative bacteria. On the left side, the pathway for iron release by specific hydrolysis of intrinsic siderophore ester linkages in trilactone scaffolds such as ferric enterobactin (hydrolyzed by E. coli Fes) or ferric bacillibactin (hydrolyzed by B. subtilis BesA) is indicated. On the right side, specific and unspecific reactions for ferric siderophore reduction are depicted. Reaction with enzymes encoded by iron-regulated genes and specifically interacting with a certain group of ferric siderophores are represented by Fe/S cluster-dependent E. coli FhuF (most specific for ferrioxamine B) and B. halodurans FchR (most specific for ferric dicitrate and ferric citrate-hydroxamates). Furthermore, unspecific possibilities of reduction (at least observed in vitro) are indicated by E. coli Fre and Fpr transferring electrons via released or stably bound flavin (Fl) cofactors, respectively. As shown in this study, iron-scavenging apoproteins such as Fe/S cluster assembly proteins and, putatively, further iron sinks such as heme and storage proteins can be regarded as (direct or indirect) acceptors of the released cytosolic iron. The intracellular binding capacity of iron may serve both as an enhancer or buffer of the upstream release reactions, mainly by influencing the actual cytosolic ferric siderophore redox potentials.

Similar articles

Cited by

References

    1. Hider R. C., Kong X. (2010) Nat. Prod. Rep. 27, 637–657 - PubMed
    1. Andrews S. C., Robinson A. K., Rodríguez-Quiñones F. (2003) FEMS Microbiol. Rev. 27, 215–237 - PubMed
    1. Namba K., Murata Y. (2010) Chem. Rec. 10, 140–150 - PubMed
    1. Devireddy L. R., Hart D. O., Goetz D. H., Green M. R. (2010) Cell 141, 1006–1017 - PMC - PubMed
    1. Miethke M., Marahiel M. A. (2007) Microbiol. Mol. Biol. Rev. 71, 413–451 - PMC - PubMed

Publication types

LinkOut - more resources