

Alterations in cerebral metabolic rate and blood supply across the adult lifespan
- PMID: 21051551
- PMCID: PMC3097991
- DOI: 10.1093/cercor/bhq224
Alterations in cerebral metabolic rate and blood supply across the adult lifespan
Abstract
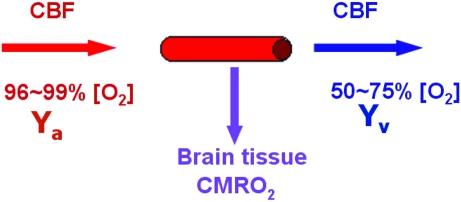
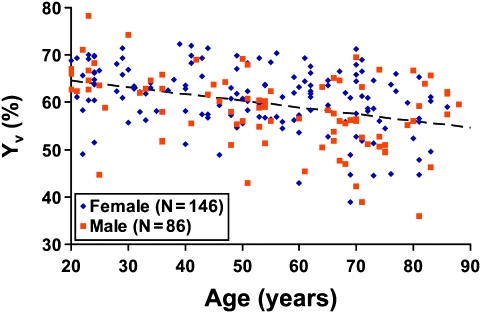
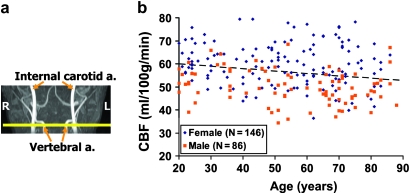
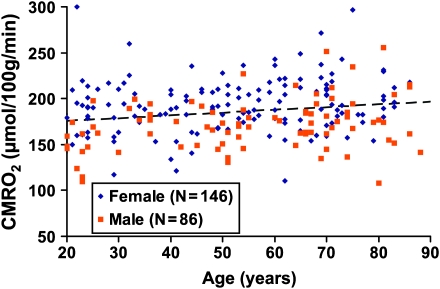
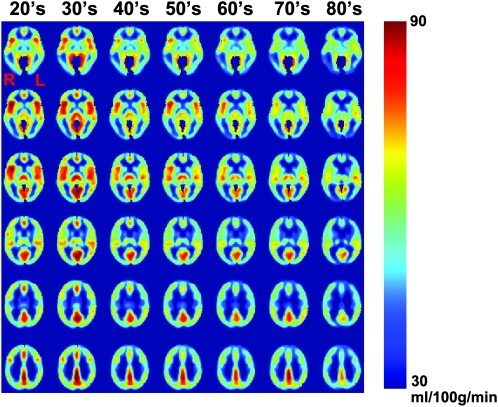
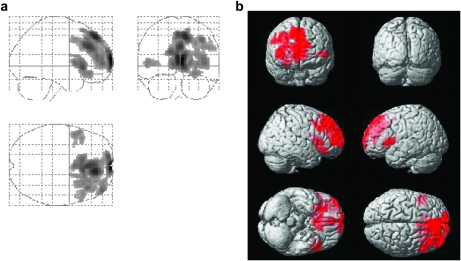
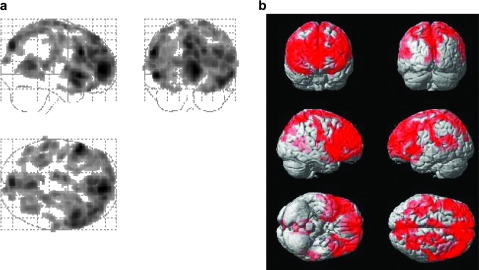
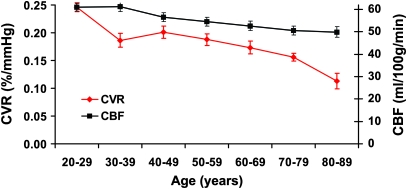
With age, the brain undergoes comprehensive changes in its function and physiology. Cerebral metabolism and blood supply are among the key physiologic processes supporting the daily function of the brain and may play an important role in age-related cognitive decline. Using MRI, it is now possible to make quantitative assessment of these parameters in a noninvasive manner. In the present study, we concurrently measured cerebral metabolic rate of oxygen (CMRO(2)), cerebral blood flow (CBF), and venous blood oxygenation in a well-characterized healthy adult cohort from 20 to 89 years old (N = 232). Our data showed that CMRO(2) increased significantly with age, while CBF decreased with age. This combination of higher demand and diminished supply resulted in a reduction of venous blood oxygenation with age. Regional CBF was also determined, and it was found that the spatial pattern of CBF decline was heterogeneous across the brain with prefrontal cortex, insular cortex, and caudate being the most affected regions. Aside from the resting state parameters, the blood vessels' ability to dilate, measured by cerebrovascular reactivity to 5% CO(2) inhalation, was assessed and was reduced with age, the extent of which was more prominent than that of the resting state CBF.
Figures
Similar articles
-
An investigation of cerebral oxygen utilization, blood flow and cognition in healthy aging.PLoS One. 2018 May 22;13(5):e0197055. doi: 10.1371/journal.pone.0197055. eCollection 2018. PLoS One. 2018. PMID: 29787609 Free PMC article.
-
Brain energy metabolism and blood flow differences in healthy aging.J Cereb Blood Flow Metab. 2012 Jul;32(7):1177-87. doi: 10.1038/jcbfm.2012.18. Epub 2012 Feb 29. J Cereb Blood Flow Metab. 2012. PMID: 22373642 Free PMC article.
-
Cerebral oxygen metabolism in neonates with congenital heart disease quantified by MRI and optics.J Cereb Blood Flow Metab. 2014 Mar;34(3):380-8. doi: 10.1038/jcbfm.2013.214. Epub 2013 Dec 11. J Cereb Blood Flow Metab. 2014. PMID: 24326385 Free PMC article.
-
Physiology of functional magnetic resonance imaging: energetics and function.Methods Mol Med. 2006;124:175-95. doi: 10.1385/1-59745-010-3:175. Methods Mol Med. 2006. PMID: 16506422 Review.
-
Nuclear medicine in the rehabilitative treatment evaluation in stroke recovery. Role of diaschisis resolution and cerebral reorganization.Eura Medicophys. 2007 Jun;43(2):221-39. Epub 2007 Feb 1. Eura Medicophys. 2007. PMID: 17268387 Review.
Cited by
-
Exercise intensity modulates the change in cerebral blood flow following aerobic exercise in chronic stroke.Exp Brain Res. 2015 Aug;233(8):2467-75. doi: 10.1007/s00221-015-4317-6. Epub 2015 May 24. Exp Brain Res. 2015. PMID: 26003127
-
Cerebrovascular CO2 reactivity and dynamic cerebral autoregulation through the eighth decade of life and their implications for cognitive decline.J Cereb Blood Flow Metab. 2024 May;44(5):712-725. doi: 10.1177/0271678X231219568. Epub 2023 Dec 8. J Cereb Blood Flow Metab. 2024. PMID: 38064286 Free PMC article.
-
Metabolic and vascular imaging markers for investigating Alzheimer's disease complicated by sleep fragmentation in mice.Front Physiol. 2024 Sep 20;15:1456690. doi: 10.3389/fphys.2024.1456690. eCollection 2024. Front Physiol. 2024. PMID: 39371598 Free PMC article.
-
Recollection-related hippocampal fMRI effects predict longitudinal memory change in healthy older adults.Neuropsychologia. 2020 Sep;146:107537. doi: 10.1016/j.neuropsychologia.2020.107537. Epub 2020 Jun 19. Neuropsychologia. 2020. PMID: 32569610 Free PMC article.
-
CVR-MRICloud: An online processing tool for CO2-inhalation and resting-state cerebrovascular reactivity (CVR) MRI data.PLoS One. 2022 Sep 28;17(9):e0274220. doi: 10.1371/journal.pone.0274220. eCollection 2022. PLoS One. 2022. PMID: 36170233 Free PMC article.
References
-
- Ashburner J, Friston KJ. Voxel-based morphometry—the methods. Neuroimage. 2000;11:805–821. - PubMed
-
- Attwell D, Laughlin SB. An energy budget for signaling in the grey matter of the brain. J Cereb Blood Flow Metab. 2001;21:1133–1145. - PubMed
-
- Baxter LR, Jr., Mazziotta JC, Phelps ME, Selin CE, Guze BH, Fairbanks L. Cerebral glucose metabolic rates in normal human females versus normal males. Psychiatry Res. 1987;21:237–245. - PubMed
