

Can rodent longevity studies be both short and powerful?
- PMID: 21051569
- PMCID: PMC3041472
- DOI: 10.1093/gerona/glq190
Can rodent longevity studies be both short and powerful?
Abstract
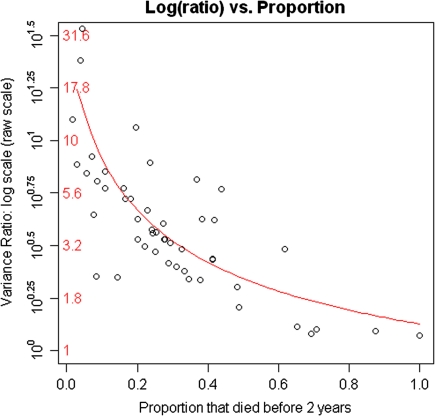
Many rodent experiments have assessed effects of diets, drugs, genes, and other factors on life span. A challenge with such experiments is their long duration, typically over 3.5 years given rodent life spans, thus requiring significant time costs until answers are obtained. We collected longevity data from 15 rodent studies and artificially truncated them at 2 years to assess the extent to which one will obtain the same answer regarding mortality effects. When truncated, the point estimates were not significantly different in any study, implying that in most cases, truncated studies yield similar estimates. The median ratio of variances of coefficients for truncated to full-length studies was 3.4, implying that truncated studies with roughly 3.4 times as many rodents will often have equivalent or greater power. Cost calculations suggest that shorter studies will be more expensive but perhaps not so much to not be worth the reduced time.
Figures
Similar articles
-
Selection for maximum longevity in mice.Exp Gerontol. 1997 Jan-Apr;32(1-2):65-78. doi: 10.1016/s0531-5565(96)00034-4. Exp Gerontol. 1997. PMID: 9088903 Review.
-
Aged-rodent models of long-term growth hormone therapy: lack of deleterious effect on longevity.J Gerontol A Biol Sci Med Sci. 1998 Nov;53(6):B452-63. doi: 10.1093/gerona/53a.6.b452. J Gerontol A Biol Sci Med Sci. 1998. PMID: 9823743
-
The necessity of having a proper dose of (-)deprenyl (D) to prolong the life spans of rats explains discrepancies among different studies in the past.Ann N Y Acad Sci. 2006 May;1067:375-82. doi: 10.1196/annals.1354.053. Ann N Y Acad Sci. 2006. PMID: 16804014
-
Genotoxicity of 1,3-butadiene and its epoxy intermediates.Res Rep Health Eff Inst. 2009 Aug;(144):3-79. Res Rep Health Eff Inst. 2009. PMID: 20017413
-
Is medical research cost effective? Response to Murphy and Topel.Perspect Biol Med. 2003 Summer;46(3 Suppl):S129-37. Perspect Biol Med. 2003. PMID: 14563079 Review.
Cited by
-
Macrophage-derived upd3 cytokine causes impaired glucose homeostasis and reduced lifespan in Drosophila fed a lipid-rich diet.Immunity. 2015 Jan 20;42(1):133-44. doi: 10.1016/j.immuni.2014.12.023. Immunity. 2015. PMID: 25601202 Free PMC article.
References
-
- Klein J, Moeschberger M. Survival Analysis: Techniques for Censored and Truncated Data. 2nd ed. New York: Springer-Verlag; 2003.
