. 2010 Nov 19;330(6007):1113-6.
doi: 10.1126/science.1194869. Epub 2010 Nov 4.

Universality in the evolution of orientation columns in the visual cortex

Affiliations

Universality in the evolution of orientation columns in the visual cortex

Matthias Kaschube et al. Science. .

Abstract

The brain's visual cortex processes information concerning form, pattern, and motion within functional maps that reflect the layout of neuronal circuits. We analyzed functional maps of orientation preference in the ferret, tree shrew, and galago--three species separated since the basal radiation of placental mammals more than 65 million years ago--and found a common organizing principle. A symmetry-based class of models for the self-organization of cortical networks predicts all essential features of the layout of these neuronal circuits, but only if suppressive long-range interactions dominate development. We show mathematically that orientation-selective long-range connectivity can mediate the required interactions. Our results suggest that self-organization has canalized the evolution of the neuronal circuitry underlying orientation preference maps into a single common design.


Figures

Fig. 1
Fig. 1
Orientation selectivity in the visual cortex of diverse boreoeutherian mammals. (A) phylogenetic relationships (–8) between mammalian ancestors, the three species examined, and rodents and lagomorphs. (Right) Arrangement of orientation-selective neurons in these species. Rodents and lagomorphs show salt-and-pepper arrangement of preferred orientations (ORs). Carnivores, primates, and tree shrews show columnar arrangement of preferred ORs. (B) Synthetic orientation maps of equal column spacing Λ but widely different pinwheel densities ρ. From left to right are the solutions of different models (, –17). Colors code preferred ORs as indicated by the bars in (C). (C) High (blue frame) and low (orange frame) pinwheel density regions in tree shrew visual cortex. (D to F) Optically recorded orientation maps in (D) tree shrew, (E) galago, and (F) ferret visual cortex. Regions shown in (C) are marked in (D).White arrows in (F)mark selected pinwheel centers. Framed regions in (C) and (F) are magnified.
Fig. 2
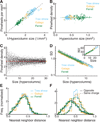
Fig. 2
Common design of orientation maps and pinwheels in ferret, tree shrew, and galago. (A) The mean number of pinwheels per square millimeter, r, scales with the inverse of hypercolumn size Λ2 in individuals of the three species (tree shrew, n = 26 hemispheres; galago, n = 9 hemispheres; ferret, n = 82 hemispheres; symbol size proportional to map size in units of Λ2). Dashed line indicates r = 〈ρ〉/Λ2 (where 〈ρ〉 = 3.14 grand average pinwheel density). (B) Dimensionless pinwheel densities ρ versus hypercolumn size. Solid lines indicate average pinwheel densities of the three species. (C) Pinwheel densities estimated for regions of up to 30 hypercolumns randomly selected from tree shrew orientation maps (12). Red dashed line indicates average pinwheel density in tree shrew. (D) SDs of pinwheel densities estimated from randomly selected regions for the three species. Black dashed curve indicates SD for a two-dimensional Poisson process of equal density. (Inset) Number variance (NV) for tree shrew, ferret, and galago and for the Poisson process. (E and F) NN distances for pinwheels of (E) arbitrary and (F) opposite and equal topological charge (12). Black curves indicate f(x) = axn/{1 + exp[(xx0)/b)]} [(E) n = 1.2, x0 = 0.48, b = 0.047], [(F) solid curve, n = 1.2, x0 = 0.46, b = 0.08; dashed curve, n = 4.5, x0 = 0.5, b = 0.05]. Distances are in units of Λ.
Fig. 3
Fig. 3
Self-organization of orientation columns dominated by long-range interactions explains the common design. (A) Nearly stationary solutions of the long-range interaction model (eqs. S10 to S13) (12) are pinwheel-rich when long-range interactions dominate and pinwheel-sparse when they are absent. (B) Pinwheel densities as a function of time without long-range interactions (green, r = 0.1, g = 2, n = 30 different random initial conditions) and when long-range interactions dominate (blue, r = 0.1, σ = 1.7, g = 0.98, n = 30 different random initial conditions). (C) Average pinwheel densities 〈ρ〉 of closed-form solutions for r ≪ 1 (eq. S20) (12). Solutions consists of n active modes (Fourier components; error bars are smaller than symbol size). In the long-range interaction model, n scales linearly with interaction range σ (12). (D) Average densities 〈ρ〉 in numerical solutions for different r at t = 300 (g = 0.98, σ = 1.7). (E to H) Spatial statistics of pinwheels (as in Fig. 2) for n = 26 randomly chosen closed-form solutions (eq. S20, n = 20 active modes) (12).
Fig. 4
Fig. 4
The common design persists under dark-rearing (A to C) but not under phase randomization (D to F) and is attained early during development (C). Orientation maps from (A) a normal and (B) a dark-reared ferret. (C) Pinwheel densities for dark-reared (n = 21) and normal ferrets (n = 82) versus postnatal age (numbers are the sample sizes). Random orientation maps (E) generated from the tree shrew orientation map (D) by phase shuffling in the Fourier domain (12). (F) Pinwheel densities of randomized maps (crosses, n = 20 randomized maps) and of original maps [diamonds, n = 4 (tree shrew, n = 2; galago, n = 2); five random maps were generated from each original map]. Red dashed line indicates average pinwheel density of randomized maps. Black dashed line indicates 3.14.

Comment in

References

    1. Hubel DH, Wiesel TN. Proc. R. Soc. London Ser. B Biol. Sci. 1977;198:1. - PubMed
    1. Blasdel GG, Salama G. Nature. 1986;321:579. - PubMed
    1. Bonhoeffer T, Grinvald A. Nature. 1991;353:429. - PubMed
    1. Ohki K, Chung S, Ch’ng YH, Kara P, Reid RC. Nature. 2005;433:597. - PubMed
    1. Ohki K, et al. Nature. 2006;442:925. - PubMed

Publication types