

Pilot study of optical coherence tomography measurement of retinal blood flow in retinal and optic nerve diseases
- PMID: 21051715
- PMCID: PMC3053109
- DOI: 10.1167/iovs.10-5985
Pilot study of optical coherence tomography measurement of retinal blood flow in retinal and optic nerve diseases
Abstract
Purpose: To investigate blood flow changes in retinal and optic nerve diseases with Doppler Fourier domain optical coherence tomography (OCT).
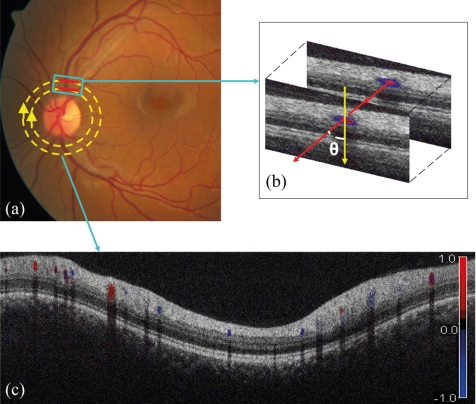
Methods: Sixty-two participants were divided into five groups: normal, glaucoma, nonarteritic ischemic optic neuropathy (NAION), treated proliferative diabetic retinopathy (PDR), and branch retinal vein occlusion (BRVO). Doppler OCT was used to scan concentric circles of 3.4- and 3.75-mm diameters around the optic nerve head. Flow in retinal veins was calculated from the OCT velocity profiles. Arterial and venous diameters were measured from OCT Doppler and reflectance images.
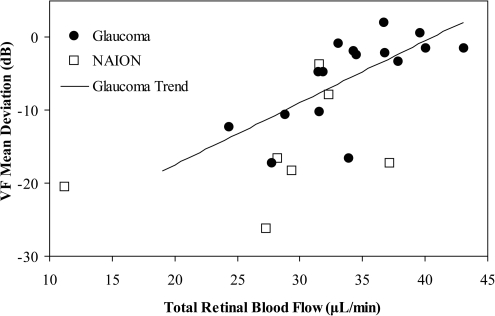
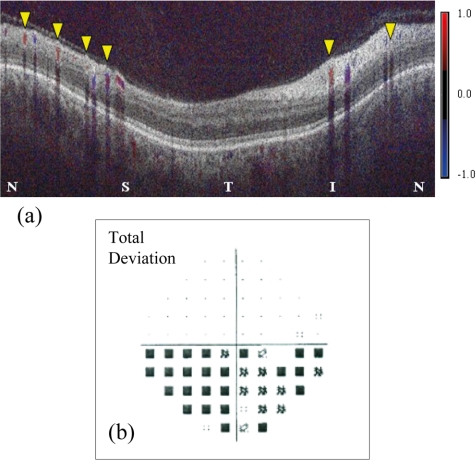
Results: Total retinal blood flow in normal subjects averaged 47.6 μL/min. The coefficient of variation of repeated measurements was 11% in normal eyes and 14% in diseased eyes. Eyes with glaucoma, NAION, treated PDR, and BRVO had significantly decreased retinal blood flow compared with normal eyes (P < 0.001). In glaucoma patients, the decrease in blood flow was highly correlated with the severity of visual field loss (P = 0.003). In NAION and BRVO patients, the hemisphere with more severe disease also had lower blood flow.
Conclusions: Doppler OCT retinal blood flow measurements showed good repeatability and excellent correlation with visual field and clinical presentations. This approach could enhance our understanding of retinal and optic nerve diseases and facilitate the development of new therapies.
Figures
Similar articles
-
ASSESSMENT OF RETINAL BLOOD FLOW IN DIABETIC RETINOPATHY USING DOPPLER FOURIER-DOMAIN OPTICAL COHERENCE TOMOGRAPHY.Retina. 2017 Nov;37(11):2001-2007. doi: 10.1097/IAE.0000000000001479. Retina. 2017. PMID: 28098726 Free PMC article.
-
Optic nerve head morphology in primary open-angle glaucoma and nonarteritic anterior ischaemic optic neuropathy measured with spectral domain optical coherence tomography.Acta Ophthalmol. 2018 Dec;96(8):e1018-e1024. doi: 10.1111/aos.13804. Epub 2018 Sep 21. Acta Ophthalmol. 2018. PMID: 30240137 Free PMC article.
-
Retinal blood flow detection in diabetic patients by Doppler Fourier domain optical coherence tomography.Opt Express. 2009 Mar 2;17(5):4061-73. doi: 10.1364/oe.17.004061. Opt Express. 2009. PMID: 19259246 Free PMC article.
-
[Nonarteritic ischemic optic neuropathy animal model and its treatment applications].Nippon Ganka Gakkai Zasshi. 2014 Apr;118(4):331-61. Nippon Ganka Gakkai Zasshi. 2014. PMID: 24864434 Review. Japanese.
-
Diseases of the retina and the optic nerve associated with obstructive sleep apnea.Sleep Med Rev. 2018 Apr;38:113-130. doi: 10.1016/j.smrv.2017.05.003. Epub 2017 May 29. Sleep Med Rev. 2018. PMID: 29107469 Review.
Cited by
-
Dynamic indocyanine green angiography measurements.J Biomed Opt. 2012 Nov;17(11):116028. doi: 10.1117/1.JBO.17.11.116028. J Biomed Opt. 2012. PMID: 23192382 Free PMC article.
-
En face Doppler total retinal blood flow measurement with 70 kHz spectral optical coherence tomography.J Biomed Opt. 2015 Jun;20(6):066004. doi: 10.1117/1.JBO.20.6.066004. J Biomed Opt. 2015. PMID: 26062663 Free PMC article.
-
Impact of intraocular pressure on changes of blood flow in the retina, choroid, and optic nerve head in rats investigated by optical microangiography.Biomed Opt Express. 2012 Sep 1;3(9):2220-33. doi: 10.1364/BOE.3.002220. Epub 2012 Aug 24. Biomed Opt Express. 2012. PMID: 23024915 Free PMC article.
-
Relationship among visual field, blood flow, and neural structure measurements in glaucoma.Invest Ophthalmol Vis Sci. 2012 May 17;53(6):3020-6. doi: 10.1167/iovs.11-8552. Invest Ophthalmol Vis Sci. 2012. PMID: 22447865 Free PMC article.
-
Deep Capillary Plexus as Biomarker of Peripheral Capillary Nonperfusion in Central Retinal Vein Occlusion.Ophthalmol Sci. 2023 Jan 2;3(2):100267. doi: 10.1016/j.xops.2022.100267. eCollection 2023 Jun. Ophthalmol Sci. 2023. PMID: 36824600 Free PMC article.
References
-
- Dumoulin CL, Hart HR., Jr Magnetic resonance angiography. Radiology. 1986;161:717–720 - PubMed
-
- Bandettini PA, Jesmanowicz A, Wong EC, Hyde JS. Processing strategies for time-course data sets in functional MRI of the human brain. Magn Reson Med. 1993;30:161–173 - PubMed
-
- Ciulla TA, Harris A, Latkany P, et al. Ocular perfusion abnormalities in diabetes. Acta Ophthalmol Scand. 2002;80:468–477 - PubMed
-
- Pournaras CJ, Rungger-Brandle E, Riva CE, Hardarson SH, Stefansson E. Regulation of retinal blood flow in health and disease. Prog Retin Eye Res. 2008;27:284–330 - PubMed
-
- Harris A, Rechtman E, Siesky B, Jonescu-Cuypers C, McCranor L, Garzozi HJ. The role of optic nerve blood flow in the pathogenesis of glaucoma. Ophthalmol Clin North Am. 2005;18:345–353 - PubMed
Publication types
MeSH terms
Grants and funding
LinkOut - more resources
Full Text Sources
Other Literature Sources
Medical
