. 2011 Apr;18(4):619-31.
doi: 10.1038/cdd.2010.134. Epub 2010 Nov 5.

Modulation of CD4+ T-cell activation by CD95 co-stimulation

Affiliations

Modulation of CD4+ T-cell activation by CD95 co-stimulation

M Paulsen et al. Cell Death Differ. 2011 Apr.

Abstract

CD95 is a dual-function receptor that exerts pro- or antiapoptotic effects depending on the cellular context, the state of activation, the signal threshold and the mode of ligation. In this study, we report that CD95 engagement modulates TCR/CD3-driven signaling pathways in resting T lymphocytes in a dose-dependent manner. While high doses of immobilized CD95 agonists silence T cells, lower concentrations augment activation and proliferation. We analyzed the co-stimulatory capacity of CD95 in detail in resting human CD4(+) T cells, and demonstrate that low-dose ligand-induced co-internalization of CD95 and TCR/CD3 complexes enables non-apoptotic caspase activation, the prolonged activation of MAP kinases, the upregulation of antiapoptotic proteins associated with apoptosis resistance, and the activation of transcription factors and cell-cycle regulators for the induction of proliferation and cytokine production. We propose that the levels of CD95L on antigen-presenting cells (APCs), neighboring T cells or epithelial cells regulate inhibitory or co-stimulatory CD95 signaling, which in turn is crucial for fine-tuning of primary T-cell activation.


Figures

Figure 1
Figure 1
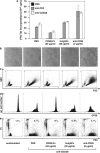
CD95 stimulation affects activation of primary T cells without induction of cell death. (a) Freshly isolated human PBMCs were stimulated for 3 days on 96-well plates coated with anti-CD3 or anti-CD3/anti-CD28 in the presence or absence of anti-CD95 mAb (here 7C11, 2 μg/ml), 20 μg/ml CD95LFc or huIgGFc as a control. Proliferation was determined by adding [3H] TdR for 16 h before harvesting. This experiment was performed in triplicates. Error bars indicate the S.D. of the mean values. (be) Purified CD4+ T cells were cultured in X-VIVO medium for 3 days in 24-well plates coated with anti-CD3/anti-CD28 in the presence or absence of anti-CD95 mAb (here anti-APO-1, 5 μg/ml), CD95LFc or Fc control protein (both 20 μg/ml). (b) Microphotographs document the increase in cell size and cluster formation as observed by inverse light microscopy. (c) Blastogenesis on the basis of cell size (forward scatter) and granularity (side scatter) was determined by FACS analysis. (d) Freshly isolated human CD4+ T cells were labeled with CFSE and stimulated as indicated. CFSE profiles were analyzed by flow cytometry. (e) Cell death of stimulated CD4+ T cells was investigated by PI-staining and FACS analysis. All experiments were performed with freshly isolated cells from different donors, and are representative of at least three independent experiments performed
Figure 2
Figure 2
CD95 ligands affect T-cell activation in a dose-dependent manner. MACS-purified human CD4+ T cells from three different donors were cultured overnight in X-VIVO medium in 96-well plates coated with or without anti-CD3 mAb and anti-CD28 mAb in the presence or absence of graded doses of plate-bound CD95LFc, CD95L-ST-Fc, LZ-CD95L or anti-CD95 mAb anti-APO-1 as indicated. The expression levels of CD25 and CD69 were monitored by flow cytometry. The percentage of CD25/CD69 double-positive cells is indicated in individual dot plots
Figure 3
Figure 3
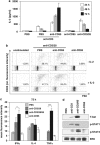
The low-dose co-stimulatory effect of CD95 is associated with IL-2 production and potentially skews a Th1 response. Freshly isolated CD4+ T cells were left untreated or treated with immobilized anti-CD3 mAb plus/minus anti-CD28 mAb in the absence or presence of 5 μg/ml anti-APO-1. (a) Secreted IL-2 was determined in supernatants by ELISA after 24, 48 and 72 h. Experiments were performed in triplicates with error bars indicating S.Ds., and are representative for three experiments carried out with different donors. (b) Exogenous rIL-2 was added where indicated. At day 3 of culture, CD25 expression was analyzed by flow cytometry using a PE-labeled anti-CD25 mAb. The percentages of CD25-positive cells are indicated in individual dot plots. (c) IFNγ, IL-4 and TNFα were measured by intracellular staining at d3. The experiment was performed in triplicates. Cytokine production is given as mean fluorescence intensities (MFI) for one representative experiment out of five with different donors. Error bars indicate S.Ds. from the MFI. Statistical differences were calculated by a standard t-test: *P<0.05; **P<0.01; ***P<0.001. (d) The expression level of T-bet and the phosphorylation of STAT1 and STAT4 were determined in cell lysates of primary human CD4+ T cells after 3 days of stimulation. Western Blot analysis was performed as described using specific antibodies against T-bet, p-STAT1, p-STAT4 and ERK as a loading control
Figure 4
Figure 4
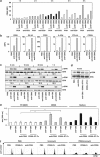
CD95 promotes upregulation of activation markers and ERK activation. Purified human CD4+ T cells were incubated in X-VIVO medium with immobilized anti-CD3 mAb or PHA for the indicated time periods in the presence or absence of plate-bound anti-CD95 mAb anti-APO-1 (5 μg/ml) (ac, e and f) or CD95L-ST-Fc (2,5 μg/ml) (e) as well as high doses of CD95L-ST-Fc (d) or CD95LFc (f) (both 20 μg/ml). The expression of CD69 (a and b) and other activation markers (b) was determined between 1–8 h (a), and at d2 (b) of incubation by flow cytometry using FITC/PE-labeled anti-CD69, anti-OX40, anti-CTLA-4, anti-CD25, anti-IL-2Rβ and anti-CD95L mAb, respectively. Expression levels are given as MFI and are representative of three independent experiments with different donors. (c–d) After incubation at 37°C for the indicated time points, T cells were lysed and aliquots of 20 μg of the whole-cell lysate were analyzed by western blot using antibodies against phospho-ERK and ERK as a loading control. (e) Cells were treated in the presence or absence of the ERK1/2 inhibitor PD 98059 (50 μM) or DMSO for 3 days before MTS assay. The experiment was performed in triplicates. Error bars represent S.Ds. from the mean. Statistical differences were calculated by student's t-test: **P<0.01. (f) CFSE-labeled CD4+ T cells were incubated in the presence of PMA, ionomycin or PMA/ionomycin with or without 20 μg/ml CD95LFc or 2 μg/ml anti-CD95 mAb (7C11), respectively. CFSE profiles were measured at d3
Figure 5
Figure 5
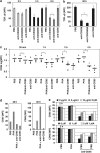
TCR and CD95 internalization are enhanced in TCR-triggered cells co-treated through low-dose CD95. Freshly isolated CD4+ T cells were incubated with plate-bound anti-CD3/CD28 mAb (a and b) or PHA (ce) in the presence or absence of immobilized anti-APO-1 (5 μg/ml). (a and b) TCR internalization was analyzed using a FITC-labeled TCRα/β-specific mAb between 2 and 8 h (a) and after 48 h of stimulation (b). The experiments were performed in triplicates. Error bars represent S.Ds. from the mean. Statistical differences were calculated by student's t-test: *P<0.05. Dead cells were excluded by FSC/SSC gating. (ce) After stimulation for 30 min to 48 h as indicated, cells were harvested and incubated on ice with 1 μg anti-APO-1 per 106 cells and PE-labeled goat-anti-mouse mAb. CytD or LatA was added where indicated. (c) Expression levels of CD95 from four different donors are denoted in MFI expressed on a logarithmic scale. The crossbar represents the arithmetic mean. Statistical significance was determined using student's t-test: *P<0.05. (d and e) Data are depicted as MFI for one representative experiment out of three with T cells from three different donors
Figure 6
Figure 6
Low-dose CD95 co-engagement induces caspase activation, expression of antiapoptotic proteins and promotes apoptosis resistance. Caspase-3/-8 activity (a) and processing (b and c) as well as cleavage of caspase substrates (c) were determined after incubation of primary human TCR-stimulated cells in the presence or absence of the indicated CD95 agonists at different concentrations. (a) Cleavage of the caspase-3/-8 specific substrates Ac-DEVD-AMC/Ac-IETD-AMC, followed by the release of the fluorogenic AMC, was used to detect activity of caspase-3/-8 in lysates from T cells incubated for 3 days with or without anti-CD3 +/− anti-CD28 mAb in the presence or absence of anti-CD95 mAb (anti-APO-1, 5 μg/ml (C3)) or CD95LFc (2.5 (C2) and 40 μg/ml (C1)). An AMC fluorescence reference standard was used to calibrate the AMC-based caspase substrates in order to quantify caspase activities (a, lower panel). In this study, we included the caspase activity of Jurkat T cells incubated with 5 μg/ml of soluble CD95LFc for 2 h to induce apoptosis. (b) Resting T cells were stimulated as indicated in the presence or absence of anti-APO-1 (5 μg/ml). Cleavage of caspase-3 was analyzed by western blot at day 1–3. (c) After 2 days of stimulation, T-cell lysates were analyzed by western blot for processed caspase-3 and -8, and the cleavage of PLCγ and PARP. ERK was used as a loading control. (d) Similarly, levels of cFLIP, Bcl-XL, IκB and phospho-IκB were determined by western blot. (e) To determine apoptosis resistance, CD4+ T cells were incubated with immobilized anti-CD3 alone or in combination with anti-APO-1 or left untreated. At d2, the cells were collected, washed and exposed to γ-irradiation or mistletoe lectin and incubated overnight. Untreated control cells were left on coated plates used for the initial stimulation. Induction of cell death was determined by PI-staining
Figure 7
Figure 7
CD95 co-stimulation induces upregulation of cell cycle-regulating proteins and promotes cell-cycle progression. Purified human CD4+ T cells were stimulated with plate-bound anti-CD3 mAb alone or in combination with anti-CD28 mAb. Anti-APO-1 (5 μg/ml) was co-immobilized where indicated. (a) At d3 of incubation, cell-cycle analysis was performed by PI-staining and determination of the DNA content by flow cytometry. Individual phases of the cell cycle, including hypodiploid apoptotic nuclei are indicated. Values denote the percentage of cells in each region. (b) At d3 of culture, the cells were prepared for western blot and analyzed for the expression or phosphorylation of several cell-cycle-regulating proteins using antibodies specific for phospho-Rb (Ser795), phospho-Rb (Ser780), phospho-Rb (Ser807/811), CDKs 1, 2 and 6, cyclins D1, D2, E and B1, PCNA and ERK as a loading control

Similar articles

Cited by

References

    1. Frauwirth KA, Thompson CB. Activation and inhibition of lymphocytes by costimulation. J Clin Invest. 2002;109:295–299. - PMC - PubMed
    1. Strasser A, Jost PJ, Nagata S. The many roles of FAS receptor signaling in the immune system. Immunity. 2009;30:180–192. - PMC - PubMed
    1. Alderson MR, Armitage RJ, Maraskovsky E, Tough TW, Roux E, Schooley K, et al. Fas transduces activation signals in normal human T lymphocytes. J Exp Med. 1993;178:2231–2235. - PMC - PubMed
    1. Kennedy NJ, Kataoka T, Tschopp J, Budd RC. Caspase activation is required for T cell proliferation. J Exp Med. 1999;190:1891–1896. - PMC - PubMed
    1. Alam A, Cohen LY, Aouad S, Sekaly RP. Early activation of caspases during T lymphocyte stimulation results in selective substrate cleavage in nonapoptotic cells. J Exp Med. 1999;190:1879–1890. - PMC - PubMed

Publication types

MeSH terms