. 2011 Apr;18(4):589-601.
doi: 10.1038/cdd.2010.129. Epub 2010 Nov 5.

Molecular characterization of apoptosis induced by CARF silencing in human cancer cells

Affiliations

Molecular characterization of apoptosis induced by CARF silencing in human cancer cells

C T Cheung et al. Cell Death Differ. 2011 Apr.

Erratum in

  • Cell Death Differ. 2011 Jul;18(7):1238

Abstract

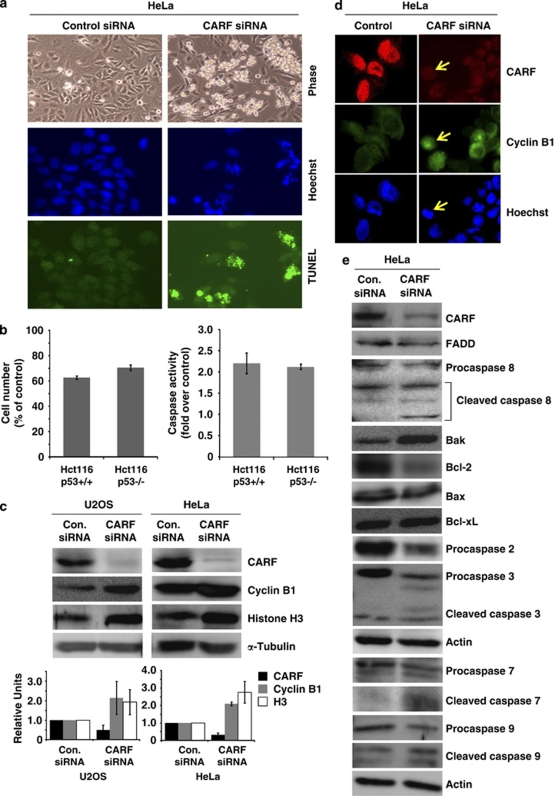
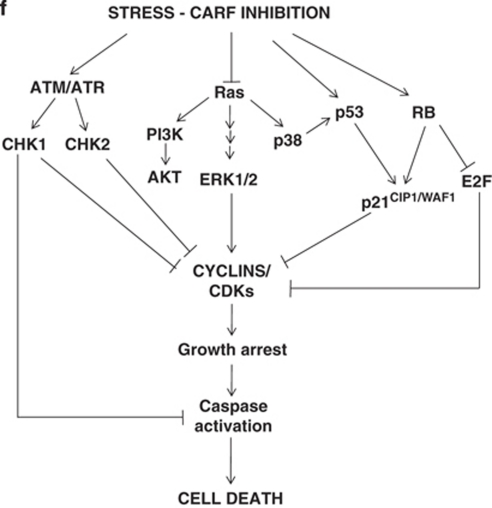
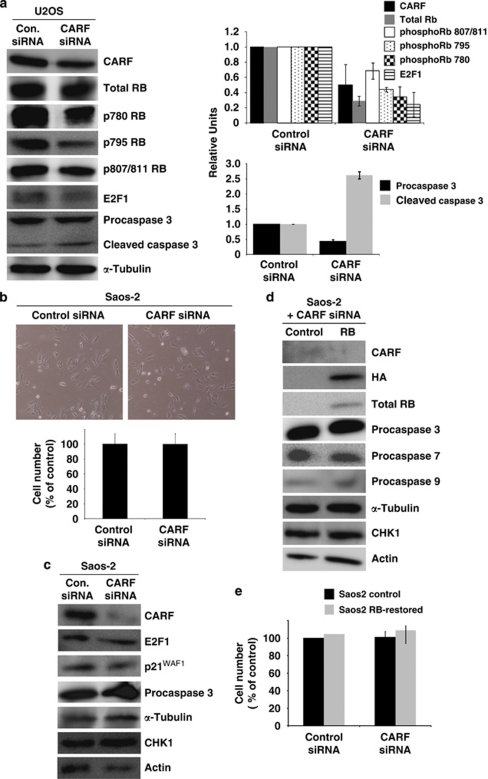
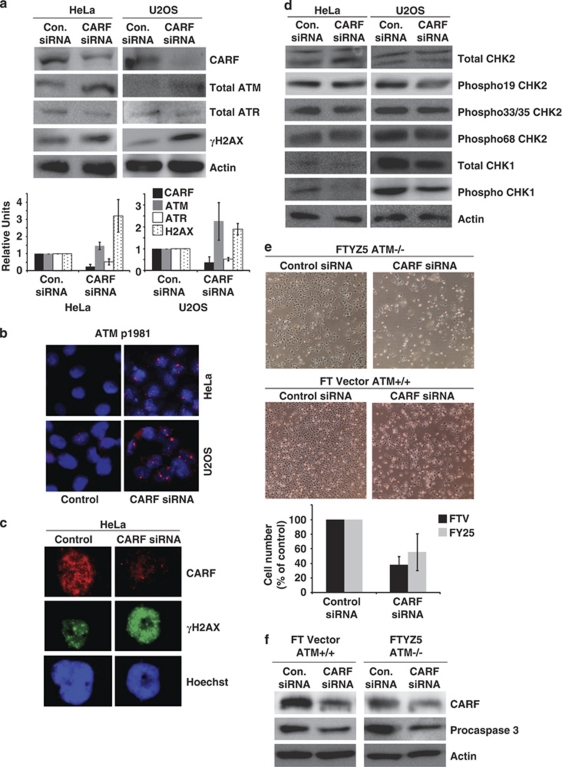
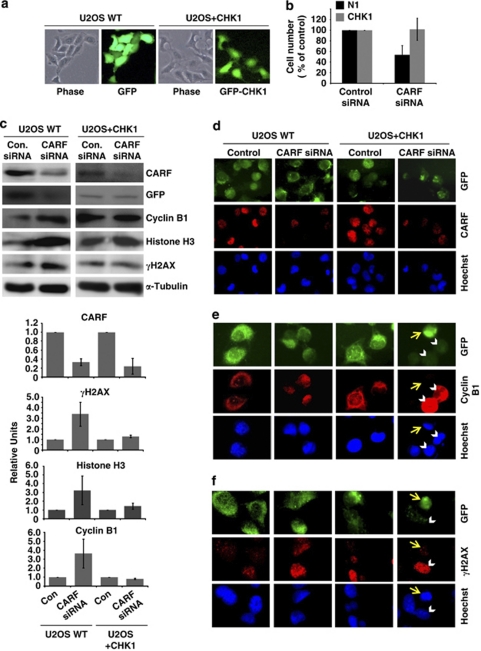
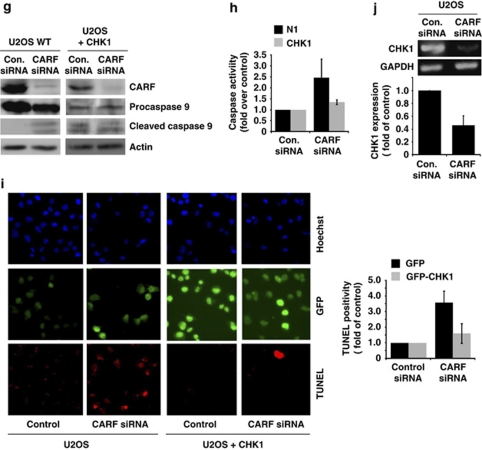
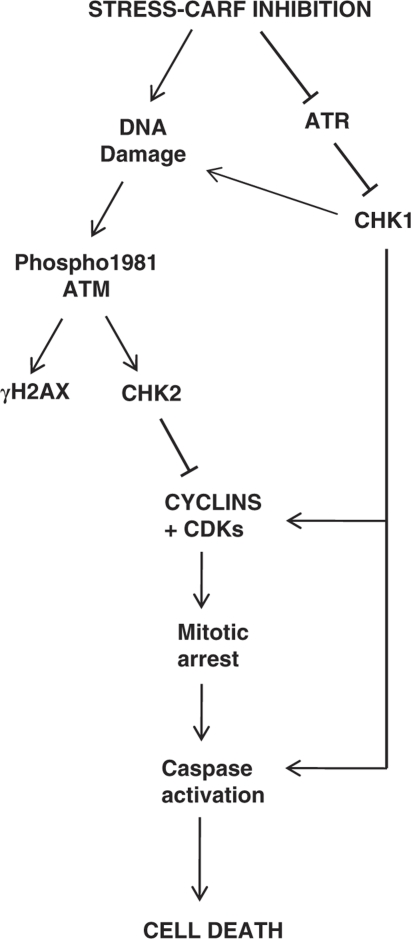
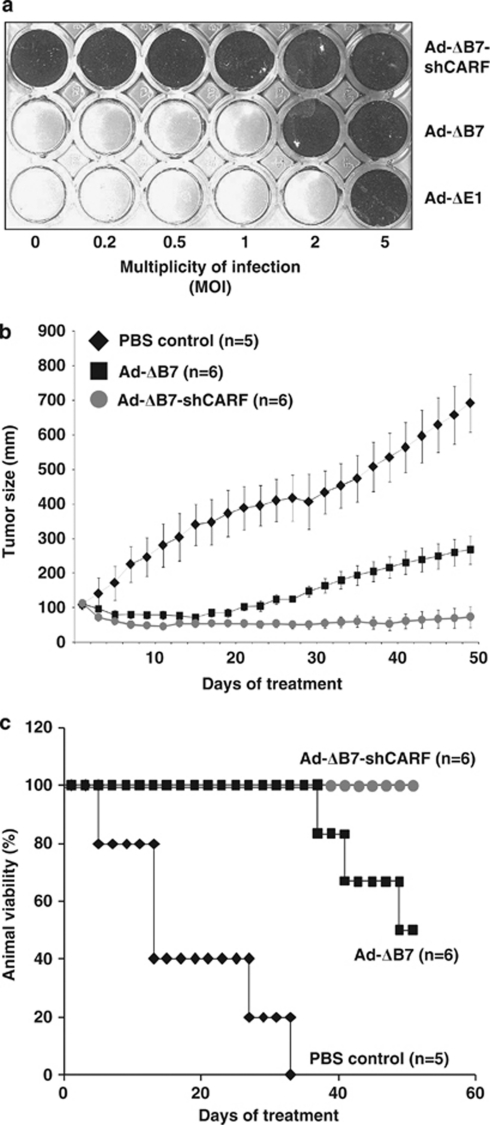
Collaborator of ARF (CARF) was cloned as an ARF-interacting protein and shown to regulate the p53-p21(WAF1)-HDM2 pathway, which is central to tumor suppression via senescence and apoptosis. We had previously reported that CARF inhibition in cancer cells led to polyploidy and caspase-dependent apoptosis, however, the mechanisms governing this phenomenon remained unknown. Thus, we examined various cell death and survival pathways including the mitochondrial stress, ataxia telangiectasia mutated (ATM)-ATR, Ras-MAP kinase and retinoblastoma cascades. We found that CARF is a pleiotropic regulator with widespread effects; its suppression affected all investigated pathways. Most remarkably, it protected the cells against genotoxicity; CARF knockdown elicited DNA damage response as evidenced by increased levels of phosphorylated ATM and γH2AX, leading to induction of mitotic arrest and eventual apoptosis. We also show that the CARF-silencing-induced apoptosis in vitro translates to in vivo. In a human tumor xenograft mouse model, treatment of developing tumors with short hairpin RNA (shRNA) against CARF via an adenovirus carrier induced complete suppression of tumor growth, suggesting that CARF shRNA is a strong candidate for an anticancer reagent. We demonstrate that CARF has a vital role in genome preservation and tumor suppression and CARF siRNA is an effective novel cancer therapeutic agent.


Figures

Figure 1
Figure 1
Cell death induced by CARF suppression occurs after mitotic arrest through the mitochondrial stress and caspase-dependent pathway. TUNEL staining of HeLa cells transfected with CARF-targeting siRNA shows increased cell death following CARF suppression (a). Syngeneic p53 +/+ and p53 −/− HCT116 cells showed comparable apoptosis (decreased cell viability, left and increase in caspase 3 activity, right) after CARF suppression (b). CARF-compromised cells underwent mitotic arrest as evidenced by accumulation of cyclin B1 and histone H3 with densitometric quantitation of representative blots from at least three experiments, in which the CARF-suppressed group is shown as fold change over control, which was set as 1 (c). Immunofluorescence shows that cells with reduced CARF levels had increased cyclin B1 nuclear accumulation, as shown by the arrows (d). CARF-compromised HeLa cells were subjected to immunoblotting analyses for proteins constituting the mitochondrial stress and caspase pathways (e). Actin and α-Tubulin were used as loading controls. Graphs are represented as average mean±S.D. (f) Schematic diagram of the hypothetical pathways that lead to cell death following CARF inhibition. We considered that apoptosis induced by CARF suppression might activate multiple pathways, including the ATM/ATR/CHK1/CHK2, Ras-MAPK and/or RB/E2F1 networks
Figure 1
Figure 1
Cell death induced by CARF suppression occurs after mitotic arrest through the mitochondrial stress and caspase-dependent pathway. TUNEL staining of HeLa cells transfected with CARF-targeting siRNA shows increased cell death following CARF suppression (a). Syngeneic p53 +/+ and p53 −/− HCT116 cells showed comparable apoptosis (decreased cell viability, left and increase in caspase 3 activity, right) after CARF suppression (b). CARF-compromised cells underwent mitotic arrest as evidenced by accumulation of cyclin B1 and histone H3 with densitometric quantitation of representative blots from at least three experiments, in which the CARF-suppressed group is shown as fold change over control, which was set as 1 (c). Immunofluorescence shows that cells with reduced CARF levels had increased cyclin B1 nuclear accumulation, as shown by the arrows (d). CARF-compromised HeLa cells were subjected to immunoblotting analyses for proteins constituting the mitochondrial stress and caspase pathways (e). Actin and α-Tubulin were used as loading controls. Graphs are represented as average mean±S.D. (f) Schematic diagram of the hypothetical pathways that lead to cell death following CARF inhibition. We considered that apoptosis induced by CARF suppression might activate multiple pathways, including the ATM/ATR/CHK1/CHK2, Ras-MAPK and/or RB/E2F1 networks
Figure 2
Figure 2
The Ras-associated pathways are not required for cell death induced by CARF suppression. Ras, total ERK and phosphoERK1/2 were evaluated by immunoblotting in CARF-compromised U2OS cells with densitometric quantitation of representative blots from at least three experiments (a). U2OS cells with overexpression of GFP-ERK1 was transfected with CARF siRNA (b), and cell viability was measured by trypan blue exclusion assay (c) and immunoblotting for procaspase 3 with densitometric quantitation of representative blots from at least three experiments (d). CARF-compromised HT1080 cells were analyzed for total ERK, phosphoERK1/2, CHK1 and caspase cleavage by immunoblotting (e). ERK1/2 was inhibited in CARF-suppressed HT1080 cells by treatment with PD98059, and cell viability was measured using the trypan blue exclusion method (f). p38MAPK and PI3K were inhibited in CARF-compromised U2OS cells by treatment with SB203580 and wortmannin, respectively, and cell viability was measured as above (g). Actin and α-Tubulin were used as loading controls. Densitometric quantitations were performed wherein, the CARF-suppressed group is shown as fold change over control siRNA, which was set as 1. Graphs are represented as average mean±S.D. Cell viability was measured as pecentage of surviving CARF-targeted cells to control siRNA-transfected cells, which was considered as 100%
Figure 3
Figure 3
Cell death induced by CARF inhibition is not critically dependent on RB. Total RB, phosphorylated RB, E2F1 and caspase 3 were analyzed by immunoblotting in CARF-compromised U2OS cells with densitometric quantitation of representative blots from at least three experiments, in which the CARF-suppressed group is shown as fold change over control, which was set as 1 (a). Saos-2 cells were transfected with CARF-targeting siRNA and cell viability was measured by the trypan blue exclusion assay (b). CARF, E2F1, p21CIP1/WAF1, caspase 3 and CHK1 were evaluated by western blotting in CARF-compromised Saos-2 cells (c). Control and RB-restored Saos-2 cells were subjected to CARF inhibition and immunoblotting for CARF, HA tag, RB, CHK1 and caspases 3, 7 and 9 was performed (d). Cell viability of control and RB-restored Saos-2 cells following CARF suppression was also conducted (e). Actin and α-Tubulin were used as loading controls. Graphs are represented as average mean±S.D. Cell viability was measured as percentage of surviving CARF-targeted cells to control siRNA-transfected cells, which was considered as 100%
Figure 4
Figure 4
CARF suppression activates the ATM pathway, but it is not required for cell death. Total ATM, total ATR and γH2AX, as well as CARF levels were analyzed by immunoblotting with densitometric quantitation of representative blots from at least three experiments, in which the CARF-suppressed group is shown as fold change over control, which was set as 1 (a). Phosphorylated ATM at serine 1981 (b) and γH2AX (c) were detected by immunofluorescent staining, wherein, blue stain denotes nuclei. The phosphorylated forms of CHK2, including phosphorylation at serine 19, serines 33/35 and threonine 68, total CHK1 and phosphorylated CHK1 were examined by western blotting (d). ATM +/+ and null cells were transfected with CARF siRNA, in which apoptosis is shown as rounded, floating cells in the images (e), and cleavage of procaspase 3 was detected by immunoblotting (f). Actin was used as loading control and Hoechst 33 258 was used for nuclear staining. Graphs are represented as average mean±S.D.
Figure 5
Figure 5
ATR–CHK1 are required for CARF-suppression-induced cell death. U2OS cells were transiently transfected with GFP-CHK1 or control vector (a). After CARF suppression, cell viability was measured by the trypan blue exclusion method, wherein, the percentage of surviving CARF-targeted cells was compared with control siRNA-transfected cells, which was considered as 100% (b). Immunoblots for CARF, GFP, γH2AX, histone H3 and cyclin B1 were performed in control and CHK-1 overexpressing cells following CARF inhibition with densitometric quantitation of representative blots from at least three experiments, in which the CARF-suppressed group is shown as fold change over control, which was set as 1 (c). Immunofluorescent staining was also performed for CARF, cyclin B1 and γH2AX in methanol/acetone-fixed cells (CARF siRNA-transfected control and CHK1 overexpressing) (df). For characterization of the apoptotic phenotype, caspase activation was examined by immunoblotting (g) and fluorescence-based assay (h) in control and CHK1-overexpressing cells following CARF knockdown. Further, TUNEL staining was conducted and quantitated by counting a total of 500–2000 cells from two independent experiments (i). Lastly, using reverse-transcription PCR for CHK1 performed in control and CARF-suppressed cells, we demonstrated that CHK1 transcripts were reduced following CARF knockdown. The PCR products were quantitated from two independent experiments, and the CARF siRNA sample is shown as fold change over control. α-Tubulin was used as loading control and Hoechst 33 258 was used for nuclear staining. Graphs are represented as average mean±S.D.
Figure 5
Figure 5
ATR–CHK1 are required for CARF-suppression-induced cell death. U2OS cells were transiently transfected with GFP-CHK1 or control vector (a). After CARF suppression, cell viability was measured by the trypan blue exclusion method, wherein, the percentage of surviving CARF-targeted cells was compared with control siRNA-transfected cells, which was considered as 100% (b). Immunoblots for CARF, GFP, γH2AX, histone H3 and cyclin B1 were performed in control and CHK-1 overexpressing cells following CARF inhibition with densitometric quantitation of representative blots from at least three experiments, in which the CARF-suppressed group is shown as fold change over control, which was set as 1 (c). Immunofluorescent staining was also performed for CARF, cyclin B1 and γH2AX in methanol/acetone-fixed cells (CARF siRNA-transfected control and CHK1 overexpressing) (df). For characterization of the apoptotic phenotype, caspase activation was examined by immunoblotting (g) and fluorescence-based assay (h) in control and CHK1-overexpressing cells following CARF knockdown. Further, TUNEL staining was conducted and quantitated by counting a total of 500–2000 cells from two independent experiments (i). Lastly, using reverse-transcription PCR for CHK1 performed in control and CARF-suppressed cells, we demonstrated that CHK1 transcripts were reduced following CARF knockdown. The PCR products were quantitated from two independent experiments, and the CARF siRNA sample is shown as fold change over control. α-Tubulin was used as loading control and Hoechst 33 258 was used for nuclear staining. Graphs are represented as average mean±S.D.
Figure 6
Figure 6
Schematic diagram of the hypothetical pathways that lead to CARF-suppression induced apoptosis. Our results excluded the crucial involvement of Ras-MAPK and RB–E2F1 pathways and demonstrated that mitotic arrest and cell death induced by CARF inhibition progresses via the ATR–CHK1 pathway
Figure 7
Figure 7
CARF suppression in vivo induces tumor regression. A549 cells were infected with MOI from 0.2–5 of shCARF-carrying adenovirus to determine the optimal dose (a). Nude mice (n=5–6 per group) were injected with 1 × 10⁷ A549 cells, and when tumors reached 100 mm3 in volume, either 3 × 10⁸ plaque forming unit of Ad-ΔB7 (squares) or Ad-ΔB7-shCARF (gray circles) were injected intratumorally three times every 2 days, at which time the tumor size was also measured (b). Survival of the animals was also recorded as percentage (%) viability (c). The mice were killed on day 50

Similar articles

Cited by

References

    1. Aylon Y, Oren M. Living with p53, dying of p53. Cell. 2007;130:597–600. - PubMed
    1. Hasan MK, Yaguchi T, Sugihara T, Kumar PK, Taira K, Reddel RR, et al. CARF is a novel protein that cooperates with mouse p19ARF (human p14ARF) in activating p53. J Biol Chem. 2002;277:37765–37770. - PubMed
    1. Hasan K, Cheung C, Kaul Z, Shah N, Sakaushi S, Sugimoto K, et al. CARF is a vital dual regulator of cellular senescence and apoptosis. J Biol Chem. 2009;284:1664–1672. - PubMed
    1. Castedo M, Perfettini JL, Roumier T, Andreau K, Medema R, Kroemer G. Cell death by mitotic catastrophe: A molecular definition. Oncogene. 2004;23:2825–2837. - PubMed
    1. Vakifahmetoglu H, Olsson M, Zhivotovsky B. Death through a tragedy: Mitotic catastrophe. Cell Death Differ. 2008;15:1153–1162. - PubMed

Publication types

MeSH terms