. 2010 Sep-Oct;15(5):051603.
doi: 10.1117/1.3483903.

Quantitative imaging reveals heterogeneous growth dynamics and treatment-dependent residual tumor distributions in a three-dimensional ovarian cancer model

Affiliations

Quantitative imaging reveals heterogeneous growth dynamics and treatment-dependent residual tumor distributions in a three-dimensional ovarian cancer model

Jonathan P Celli et al. J Biomed Opt. 2010 Sep-Oct.

Abstract

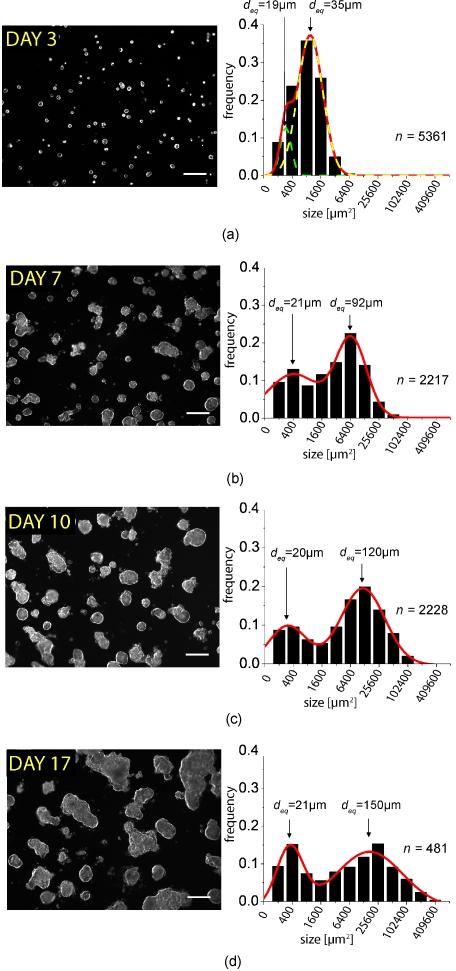
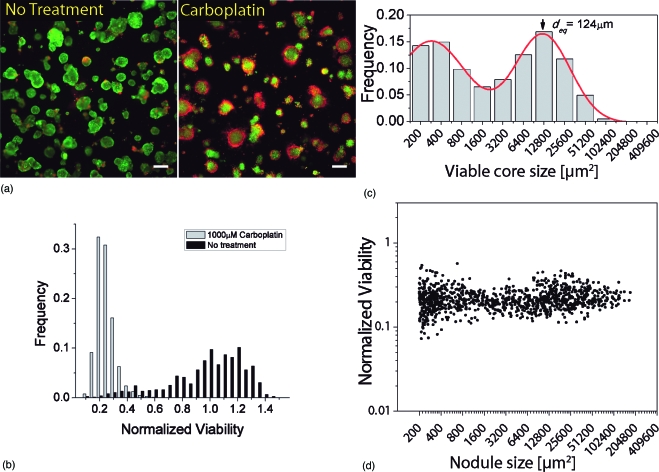
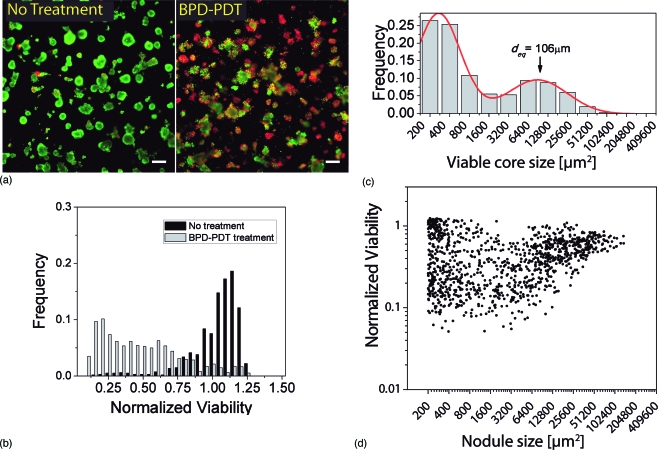
Three-dimensional tumor models have emerged as valuable in vitro research tools, though the power of such systems as quantitative reporters of tumor growth and treatment response has not been adequately explored. We introduce an approach combining a 3-D model of disseminated ovarian cancer with high-throughput processing of image data for quantification of growth characteristics and cytotoxic response. We developed custom MATLAB routines to analyze longitudinally acquired dark-field microscopy images containing thousands of 3-D nodules. These data reveal a reproducible bimodal log-normal size distribution. Growth behavior is driven by migration and assembly, causing an exponential decay in spatial density concomitant with increasing mean size. At day 10, cultures are treated with either carboplatin or photodynamic therapy (PDT). We quantify size-dependent cytotoxic response for each treatment on a nodule by nodule basis using automated segmentation combined with ratiometric batch-processing of calcein and ethidium bromide fluorescence intensity data (indicating live and dead cells, respectively). Both treatments reduce viability, though carboplatin leaves micronodules largely structurally intact with a size distribution similar to untreated cultures. In contrast, PDT treatment disrupts micronodular structure, causing punctate regions of toxicity, shifting the distribution toward smaller sizes, and potentially increasing vulnerability to subsequent chemotherapeutic treatment.


Figures

Figure 1
Figure 1
Representative dark-field microscopy images of in vitro 3-D acini and corresponding size distribution histograms and Gaussian fits from analysis of image data obtained at (a) day 3 following plating and (b) day 7, (c) day 10, and (d) day 17. The n values on the right of each histogram indicate the number of nodules included in each histogram. Scale bars=250 μm.
Figure 2
Figure 2
Characterization and quantification of growth behavior from time lapse microscopy correlated with analysis of longitudinal darkfield image data (shown in Fig. 1). (a) Individual frames from time-lapse microscopy acquired from 4 h following plating until 4 days following plating (the full time-lapse sequence is included as a video). Yellow arrows indicate clusters of cells that rapidly migrate over the Matrigel surface and assemble to form larger multicellular acini. The green box indicates a representative cell that does not participate in assembly events in the immediate vicinity, but does undergo cell division. Scale bars=100 μm. (b) Schematic representation of the bimodal growth kinetics described in Fig. 1 and (a). Approximately 30% of cells (gray), exhibit low motility and little potential to migrate toward other clusters of cells. The other 70% of cells (beige cells) exhibit a much more aggressive growth behavior, rapidly forming larger and larger multicellular aggregates. The sequential numbering 1, 2, and 3 in the diagram indicates (1) single cells following plating that (2) form small clusters and (3) subsequently form larger multicellular clusters. Inset: confocal immunofluorescence section from the center of a nodule fixed and stained for E-cadherin (red) and DAPI (blue) at day 10 of growth to reveal large multicellular 3-D structures formed from assembly and division of individual cells on the gel surface. Scale bar=20 μm. (c) Assembly events lead to an overall decay in the spatial density of 3-D acini with a decay constant of 5.9 days−1. Error bars in (c) are standard deviations of density measurements from five fields, each of three to nine independent prepared culture dishes imaged at a given time point. (d) Exponential decay in density is concomitant with an increase in mean diameter over time of rapidly growing nodules [corresponding to sc2 from Gaussian fits in Fig. 1 and Eq. 1 of the text]. Mean diameter remains constant in the remaining nodules [sc1 in Eq. 1]. Error bars in (d) are derived from the widths of Gaussian fits shown in Fig. 1. (QuickTime, 1.45 MB) .
Figure 3
Figure 3
Carboplatin treatment response assessed by quantitative ratiometric fluorescence imaging. (a) Representative LIVE∕DEAD fluorescence image of 3-D culture subject to 1000 μM carboplatin treatment and corresponding no treatment control grown in identical conditions. The carboplatin treated plate exhibits a pattern of cytotoxic response in which cores of 3-D nodules remain viable (green) while cells at the periphery are dead. Display images adjusted with hi-lo lookup table (all quantitative analysis is based on raw unprocessed images). Scale bars=250 μm. (b) Distribution of viabilities in carboplatin treated nodules. Mean viability is 0.22 with standard deviation of 0.07 (minimum value 0.073, maximum value 0.57). (c) Size distribution of residual viable disease based on analysis of green (live) channel data of carboplatin-treated cultures by the same methods used in growth characterization as already described. The distribution resembles the untreated cultures at day 10, indicating growth arrest during treatment, with the mean diameter of larger nodules approximately the same as untreated day 10 cultures. (d) Combined plot of normalized viability versus nodule size for 1000 μM carboplatin-treated 3-D cultures plotted on the same log scale as (c). Each data point corresponds to an individual 3-D nodule and is obtained by segmentation of the dark-field image to report size and viability based on intensity data from corresponding fluorescence images of the same spatial field. The bimodal size distribution is readily evident from the two dense clusters of data points to either side of a sparse region between 1600 and 3200 μm2.
Figure 4
Figure 4
Photodynamic therapy treatment response assessed by quantitative ratiometric fluorescence imaging. (a) Representative LIVE∕DEAD fluorescence image of 3-D culture subject to 10 J∕cm2 BPD-PDT treatment showing a profoundly different pattern of response than the chemotherapy treatment (Fig. 3). While some nodules are relatively unaffected (mostly viable, green), others are structurally degraded with pockets of deep red fluorescence throughout. Display images adjusted using the hi-lo lookup table (all quantitative analysis is based on raw unprocessed images). Scale bars=250 μm. (b) Distribution of viabilities in 10-J∕cm2 BPD-PDT treated nodules. Mean viability is 0.46 with standard deviation of 0.29 (minimum value 0.05, maximum value 1.2). (c) Size distribution of residual viable disease based on analysis of green (live) channel data of BPD-PDT treated cultures by the same methods used in growth characterization already described. Although mean viability is higher than in the case of the 1000 μM carboplatin incubation, the distribution is dramatically shifted toward smaller sized nodules. The position of the larger population peak is shifted to the left with respect to normal growth [Fig. 1c] or carboplatin incubation [Fig. 3c]. (d) Plot of normalized viability versus nodule size in 10-J∕cm2 BPD-PDT treated cultures. Each data point corresponds to an individual 3-D nodule and is obtained by segmentation of the dark-field image to report size and viability based on intensity data from corresponding fluorescence images of the same spatial field. Size-dependent response exhibits a high degree of scattering in the viabilities of small nodules likely generated by disruption of larger nodules during PDT treatment.

References

    1. Debnath J. and Brugge J. S., “Modelling glandular epithelial cancers in three-dimensional cultures,” Nat. Rev. Cancer NRCAC4 5(9), 675–688 (2005).10.1038/nrc1695 - DOI - PubMed
    1. Debnath J., Mills K. R., Collins N. L., Reginato M. J., Muthuswamy S. K., and Brugge J. S., “The role of apoptosis in creating and maintaining luminal space within normal and oncogene-expressing mammary acini,” Cell CELLB5 111(1), 29–40 (2002).10.1016/S0092-8674(02)01001-2 - DOI - PubMed
    1. Muthuswamy S. K., Li D., Lelievre S., Bissell M. J., and Brugge J. S., “ErbB2, but not ErbB1, reinitiates proliferation and induces luminal repopulation in epithelial acini,” Nat. Cell Biol. NCBIFN 3(9), 785–792 (2001).10.1038/ncb0901-785 - DOI - PMC - PubMed
    1. Bissell M. J., Weaver V. M., Lelievre S. A., Wang F., Petersen O. W., and Schmeichel K. L., “Tissue structure, nuclear organization, and gene expression in normal and malignant breast,” Cancer Res. CNREA8 59(7 Suppl.), 1757–1763s, discussion 1763s–1764s (1999). - PubMed
    1. Ohmori T., Yang J. L., Price J. O., and Arteaga C. L., “Blockade of tumor cell transforming growth factor-betas enhances cell cycle progression and sensitizes human breast carcinoma cells to cytotoxic chemotherapy,” Exp. Cell Res. ECREAL 245(2), 350–359 (1998).10.1006/excr.1998.4261 - DOI - PubMed

Publication types

MeSH terms