

Binding to and photo-oxidation of cardiolipin by the phthalocyanine photosensitizer Pc 4
- PMID: 21054078
- PMCID: PMC2945736
- DOI: 10.1117/1.3484256
Binding to and photo-oxidation of cardiolipin by the phthalocyanine photosensitizer Pc 4
Abstract
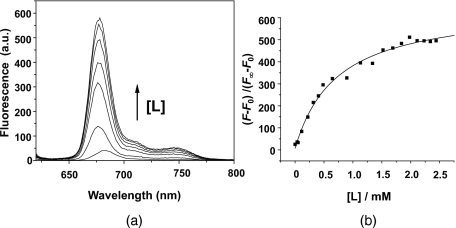
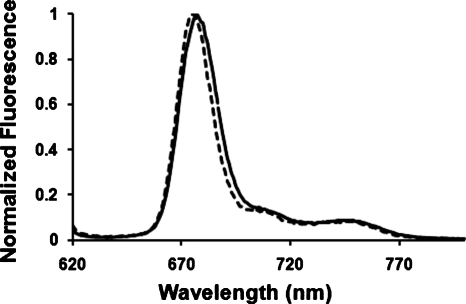
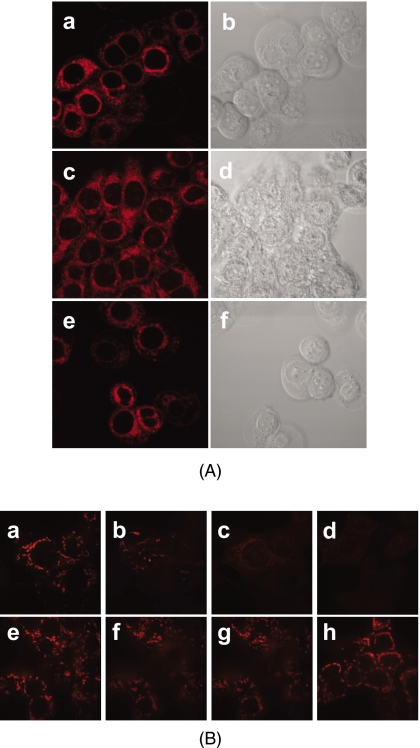
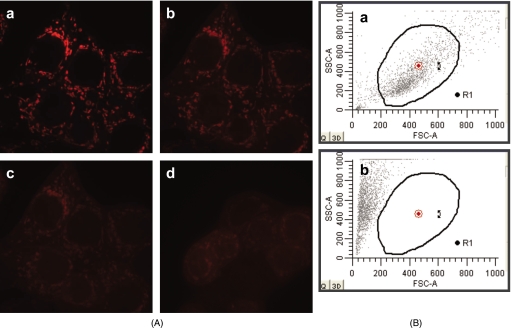
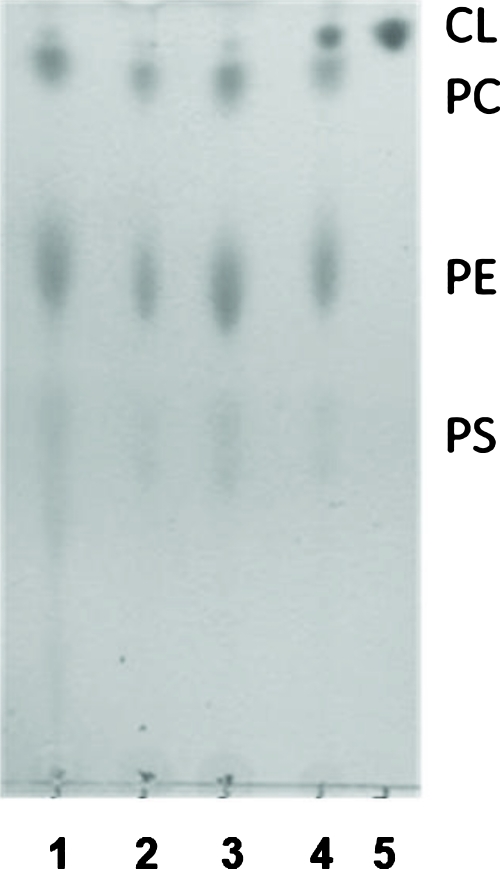
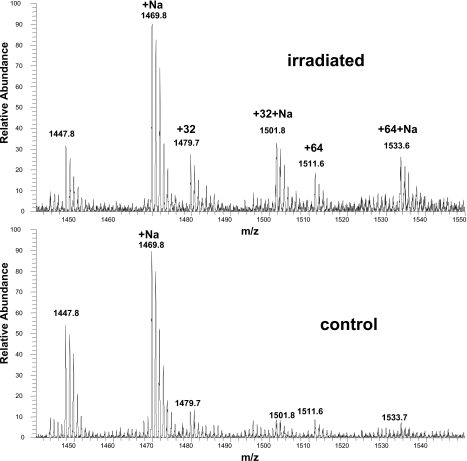
Cardiolipin is a unique phospholipid of the mitochondrial inner membrane. Its peroxidation correlates with release of cytochrome c and induction of apoptosis. The phthalocyanine photosensitizer Pc 4 binds preferentially to the mitochondria and endoplasmic reticulum. Earlier Förster resonance energy transfer studies showed colocalization of Pc 4 and cardiolipin, which suggests cardiolipin as a target of photodynamic therapy (PDT) with Pc 4. Using liposomes as membrane models, we find that Pc 4 binds to cardiolipin-containing liposomes similarly to those that do not contain cardiolipin. Pc 4 binding is also studied in MCF-7c3 cells and those whose cardiolipin content was reduced by treatment with palmitate. Decreased levels of cardiolipin are quantified by thin-layer chromatography. The similar level of binding of Pc 4 to cells, irrespective of palmitate treatment, supports the lack of specificity of Pc 4 binding. Thus, factors other than cardiolipin are likely responsible for the preferential localization of Pc 4 in mitochondria. Nonetheless, cardiolipin within liposomes is readily oxidized by Pc 4 and light, yielding apparently mono- and dihydroperoxidized cardiolipin. If similar products result from exposure of cells to Pc 4-PDT, they could be part of the early events leading to apoptosis following Pc 4-PDT.
Figures
Similar articles
-
Fluorescence resonance energy transfer reveals a binding site of a photosensitizer for photodynamic therapy.Cancer Res. 2003 Sep 1;63(17):5194-7. Cancer Res. 2003. PMID: 14500343
-
Photo-oxidation of cardiolipin and cytochrome c with bilayer-embedded Pc 4.Free Radic Biol Med. 2010 Sep 1;49(5):718-25. doi: 10.1016/j.freeradbiomed.2010.05.014. Epub 2010 May 25. Free Radic Biol Med. 2010. PMID: 20510355 Free PMC article.
-
Loss of cardiolipin in palmitate-treated GL15 glioblastoma cells favors cytochrome c release from mitochondria leading to apoptosis.J Neurochem. 2008 May;105(3):1019-31. doi: 10.1111/j.1471-4159.2007.05209.x. Epub 2007 Dec 24. J Neurochem. 2008. PMID: 18182042
-
Molecular mechanisms of apoptosis. structure of cytochrome c-cardiolipin complex.Biochemistry (Mosc). 2013 Oct;78(10):1086-97. doi: 10.1134/S0006297913100027. Biochemistry (Mosc). 2013. PMID: 24237142 Review.
-
Cardiolipin asymmetry, oxidation and signaling.Chem Phys Lipids. 2014 Apr;179:64-9. doi: 10.1016/j.chemphyslip.2013.11.010. Epub 2013 Dec 1. Chem Phys Lipids. 2014. PMID: 24300280 Free PMC article. Review.
Cited by
-
Cardiolipin: characterization of distinct oxidized molecular species.J Lipid Res. 2011 Jan;52(1):125-35. doi: 10.1194/jlr.M010520. Epub 2010 Sep 20. J Lipid Res. 2011. PMID: 20858593 Free PMC article.
-
Targeting mitochondria by Zn(II)N-alkylpyridylporphyrins: the impact of compound sub-mitochondrial partition on cell respiration and overall photodynamic efficacy.PLoS One. 2014 Sep 24;9(9):e108238. doi: 10.1371/journal.pone.0108238. eCollection 2014. PLoS One. 2014. PMID: 25250732 Free PMC article.
-
Characterization and optimization of pH-responsive polymer nanoparticles for drug delivery to oral biofilms.J Mater Chem B. 2016 May 14;4(18):3075-3085. doi: 10.1039/C5TB02054A. Epub 2015 Nov 20. J Mater Chem B. 2016. PMID: 27429754 Free PMC article.
References
-
- MacDonald I. and Dougherty T. J., “Basic principles of photodynamic therapy,” J. Porphyr. Phthalocyanines JPPHFZ 5, 105–129 (2001).10.1002/jpp.328 - DOI
-
- Weishaupt K. R., Gomer C. J., and Dougherty T. J., “Identification of singlet oxygen as the cytotoxic agent in photoinactivation of a murine tumor,” Cancer Res. CNREA8 36(7, Pt. 1), 2326–2329 (1976). - PubMed
-
- Buytaert E., Dewaele M., and Agostinis P., “Molecular effectors of multiple cell death pathways initiated by photodynamic therapy,” Biochim. Biophys. Acta BBACAQ 1776(1), 86–107 (2007). - PubMed
Publication types
MeSH terms
Substances
Grants and funding
LinkOut - more resources
Full Text Sources
Other Literature Sources
