. 2011 Jul;202(3):361-78.
doi: 10.1111/j.1748-1716.2010.02214.x. Epub 2010 Dec 7.

Urine concentrating mechanism in the inner medulla of the mammalian kidney: role of three-dimensional architecture

Affiliations

Urine concentrating mechanism in the inner medulla of the mammalian kidney: role of three-dimensional architecture

W H Dantzler et al. Acta Physiol (Oxf). 2011 Jul.

Abstract

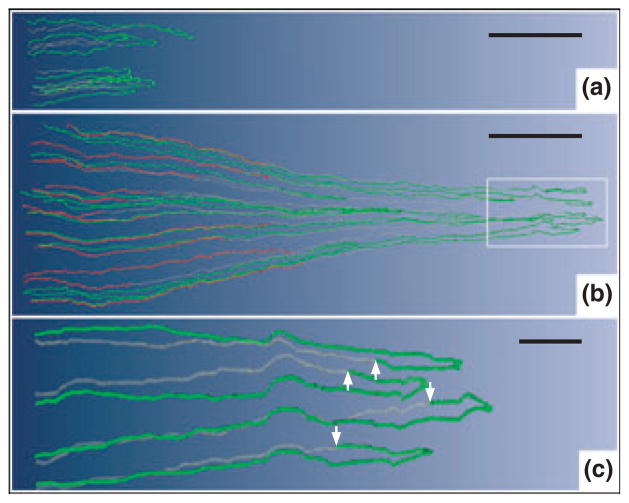
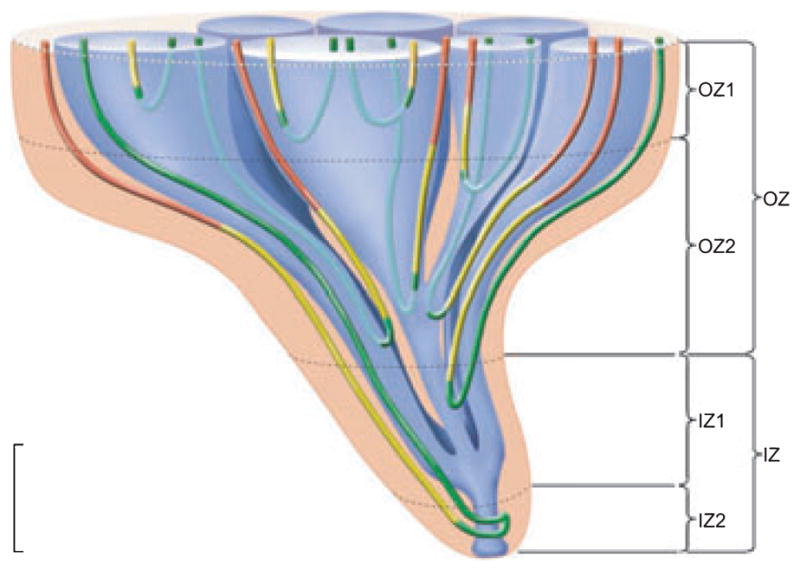
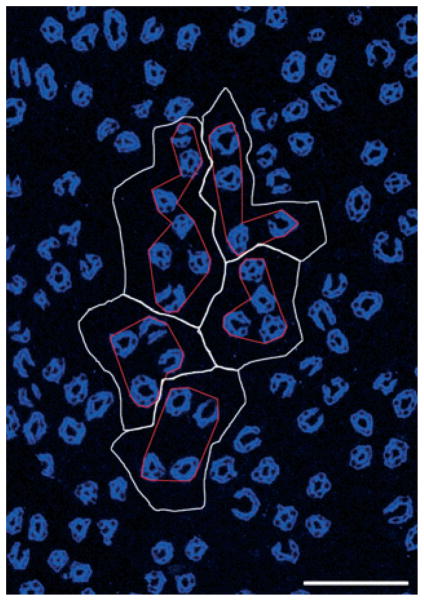
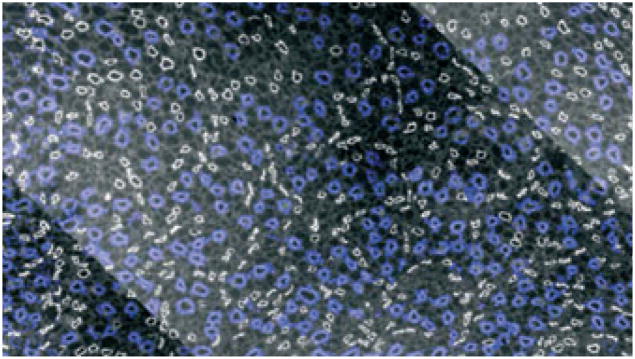
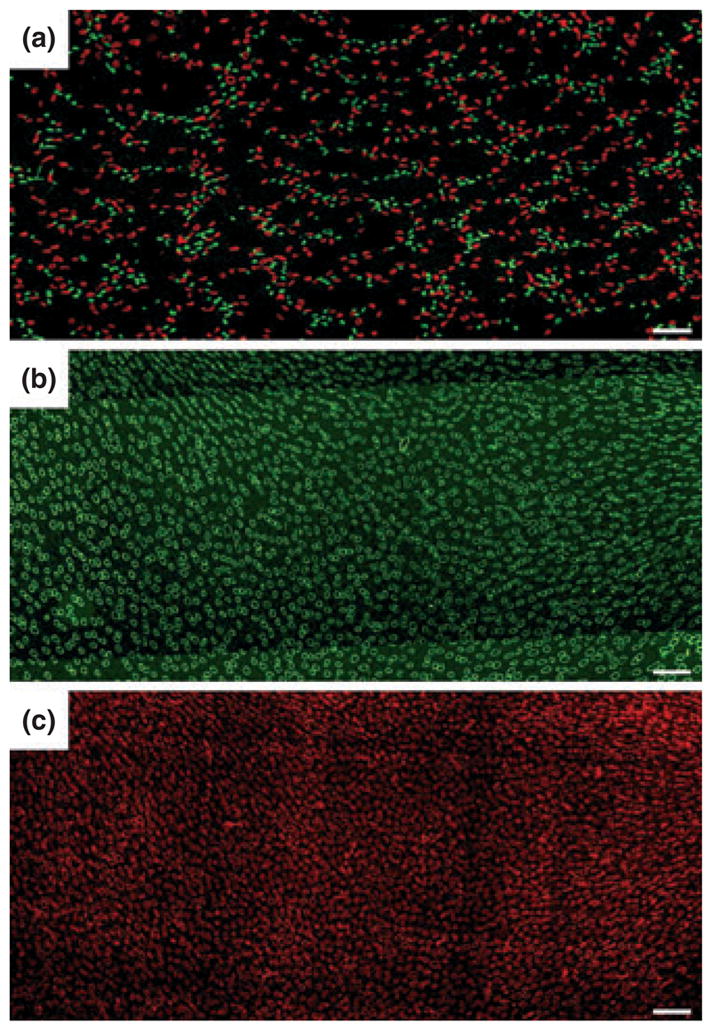
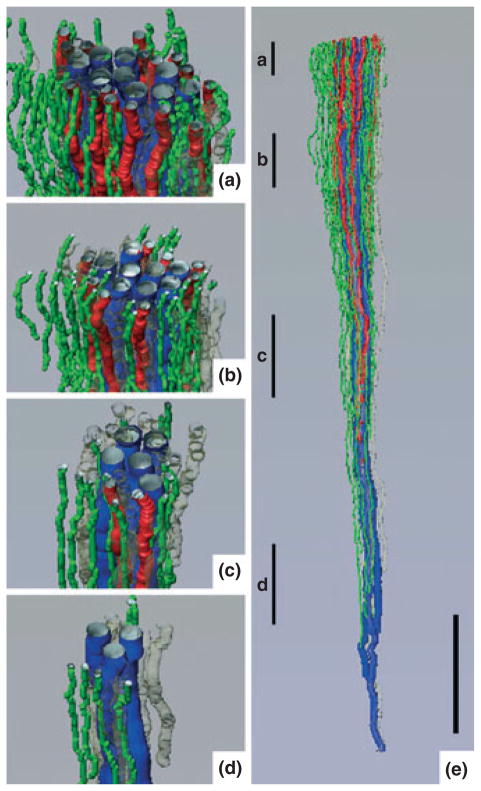
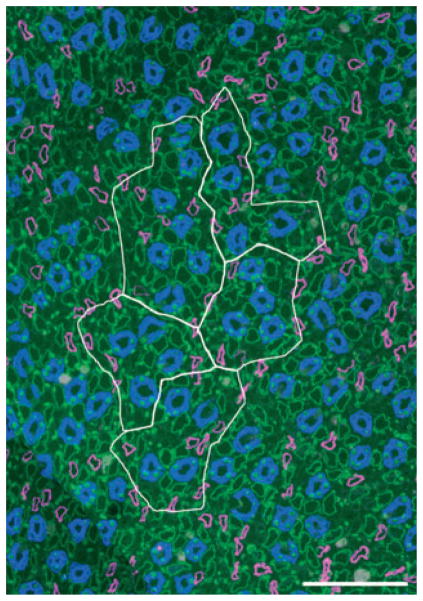
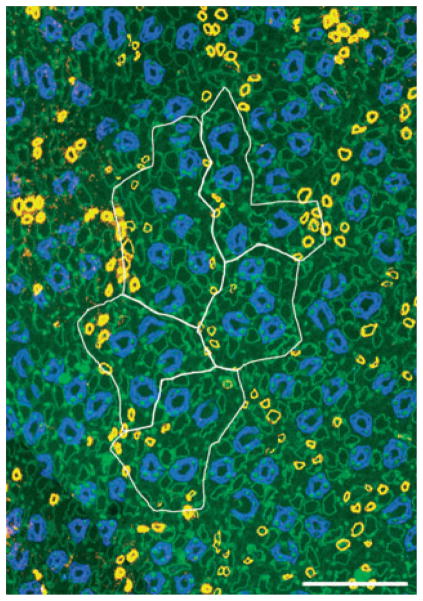
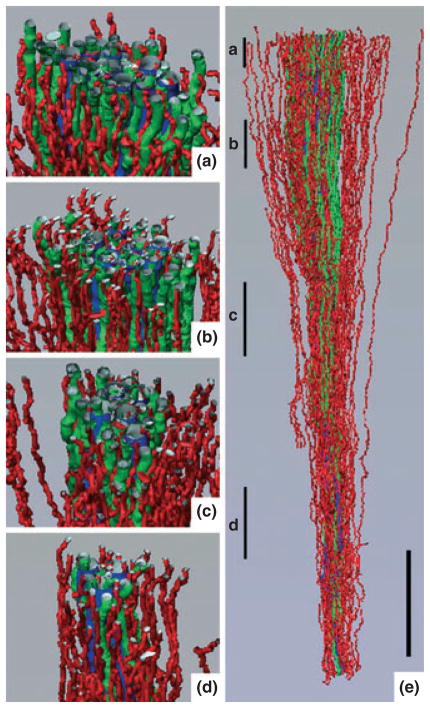
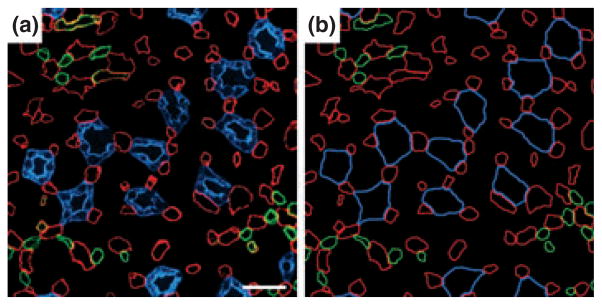
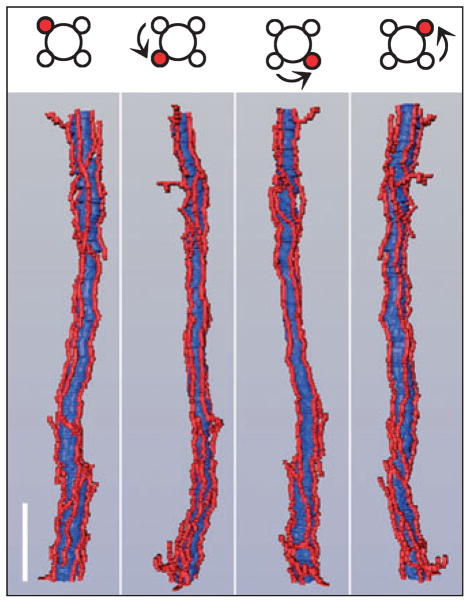
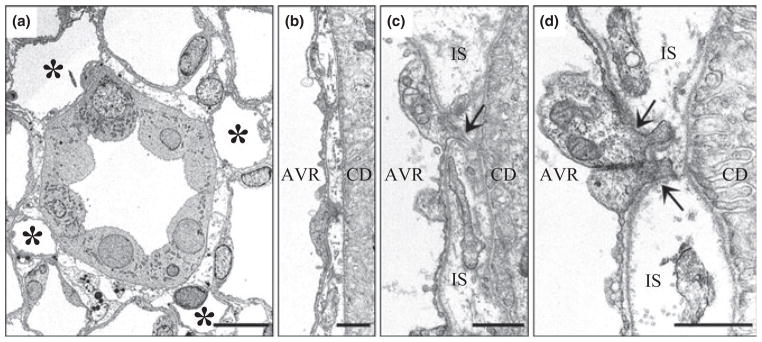
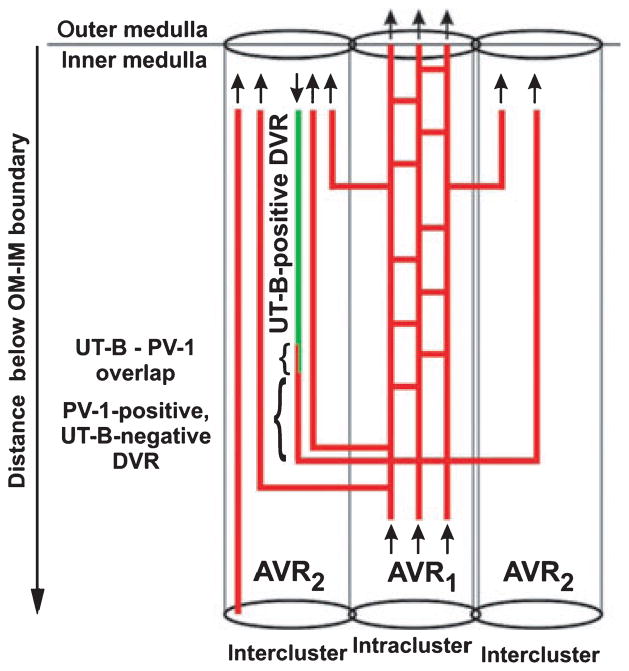
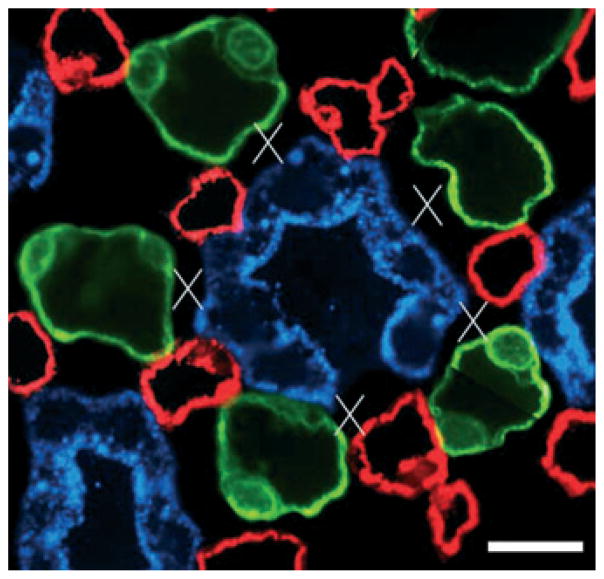
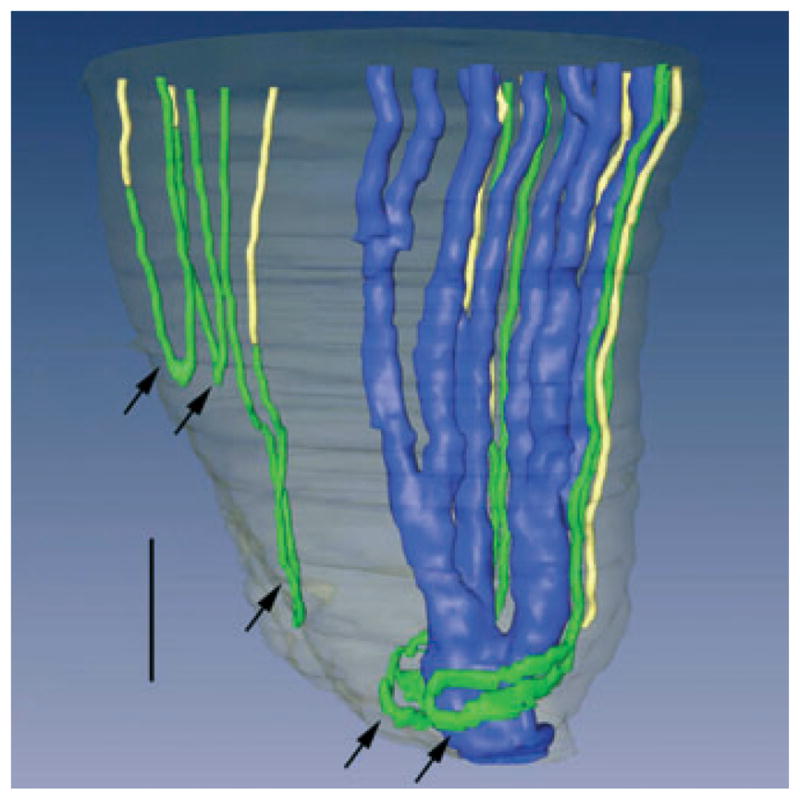
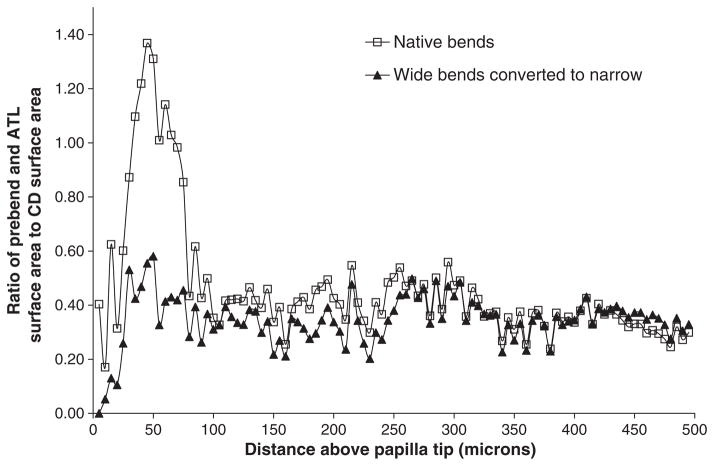
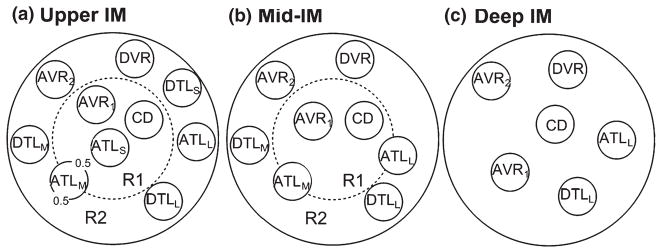
The urine concentrating mechanism in the mammalian renal inner medulla (IM) is not understood, although it is generally considered to involve countercurrent flows in tubules and blood vessels. A possible role for the three-dimensional relationships of these tubules and vessels in the concentrating process is suggested by recent reconstructions from serial sections labelled with antibodies to tubular and vascular proteins and mathematical models based on these studies. The reconstructions revealed that the lower 60% of each descending thin limb (DTL) of Henle's loops lacks water channels (aquaporin-1) and osmotic water permeability and ascending thin limbs (ATLs) begin with a prebend segment of constant length. In the outer zone of the IM (i) clusters of coalescing collecting ducts (CDs) form organizing motif for loops of Henle and vasa recta; (ii) DTLs and descending vasa recta (DVR) are arrayed outside CD clusters, whereas ATLs and ascending vasa recta (AVR) are uniformly distributed inside and outside clusters; (iii) within CD clusters, interstitial nodal spaces are formed by a CD on one side, AVR on two sides, and an ATL on the fourth side. These spaces may function as mixing chambers for urea from CDs and NaCl from ATLs. In the inner zone of the IM, cluster organization disappears and half of Henle's loops have broad lateral bends wrapped around terminal CDs. Mathematical models based on these findings and involving solute mixing in the interstitial spaces can produce urine slightly more concentrated than that of a moderately antidiuretic rat but no higher.


Conflict of interest statement

Conflicts of interest

None.

Figures

Figure 1
Figure 1
Computer-assisted reconstruction of loops of Henle from rat inner medulla (IM) showing expression of aquaporin-1 (AQP1; red) and chloride channel (ClC-K1; green); grey regions (αB-crystallin) express undetectable levels of AQP1 and ClC-K1. Loops are oriented along the corticomedullary axis, with the left edge of each image nearer the base of the IM. (a) Thin limbs that have their bends within the first millimetre beyond the OM–IM boundary. Descending segments lack detectable AQP1. ClC-K1 is expressed continuously along the prebend segment and the ATL. (b) Loops that have their bends beyond the first millimetre of the IM. AQP1 is expressed along the initial 40% of each descending thin limb (DTL) and is absent from the remainder of each loop. ClC-K1 is expressed continuously along the prebend segment and the ATL. Boxed area is enlarged in c. (c) Enlargement of near-bend regions of four thin limbs from box in b. ClC-K1 expression, corresponding to DTL prebend segment, begins, on average, 165 μm before the loop bend (arrows). Scale bars: 500 μm (a and b); 100 μm (c). From Layton et al. (2004), used with permission.
Figure 2
Figure 2
Four zones of the inner medulla (IM) are distinguishable based on data from Pannabecker, et al. (2008a). These include an outer zone (OZ) which encompasses the initial 3.0–3.5 mm below the OM/IM border and includes OZ1 and OZ2. Collecting duct (CD) clusters, which coalesce into single CDs, are shown in blue. Aquaporin-1 (AQP-1)-positive and AQP1-negative descending thin limbs (DTLs) are shown in red and yellow respectively. Prebend segments and ascending thin limbs are shown in green. In the OZ, CDs form the organizing motif around which loops of Henle and blood vessels (not shown) are arranged. OZ 1 includes those loops that express no detectable AQP1. Loops expressing AQP1 along their initial 40% are present in OZ1 and OZ2. An inner zone (IZ) encompasses the terminal 1.5–2.0 mm and includes IZ1 and IZ2. In the IZ the central organizing motif of CD clusters is diminished and no detectable AQP1 is expressed in DTLs. No detectable AQP1 or UT-B is expressed in blood vessels, and all vasa recta are fenestrated. IZ2 includes the terminal 500 μm of the papilla tip where transverse-running segments lie. See text for additional details. Scalebar, 1 mm along the axial dimension, lateral dimensions are not to scale. From Layton et al. (2009), used with permission.
Figure 3
Figure 3
Five primary clusters making up a single secondary collecting duct (CD) cluster that consists of 31 CDs (aquaporin- 2, blue) at the inner medulla (IM) base. Image taken from section at 400 μm below IM base. CD cluster boundaries (white) determined by Euclidean distance map technique. Polygons (red) delimit the intracluster interstitium for each of the five primary CD clusters. Scalebar, 100 μm. From Pannabecker et al. (2008b), used with permission.
Figure 4
Figure 4
Transverse section of inner medulla (IM) taken approx. 40 μm below the OM–IM border (IM base) showing collecting duct (CD) clusters in blue surrounded by descending thin limbs in white. Scale bar: 100 μm. From Pannabecker and Dantzler (2004), used with permission.
Figure 5
Figure 5
(a) Transverse section showing reticulated pattern formed by distribution of descending thin limbs (DTLs) [aquaporin-1 (AQP1); red] and descending vasa recta (DVR) (urea transporter B; green) across a single plane of the inner medulla (IM). Each void, or black space encompassed by DTLs and DVR, is filled by a single cluster of collecting ducts (CDs) that coalesce as a unit as the segments descend from the IM base toward the papilla. Section (a) is from approx. 900 μm below IM base. (b) and (c) show nearly uniform distribution of ascending thin limbs (ATLs) (chloride channel ClC-K1; green) and ascending vasa recta (PV-1; red) in adjacent transverse sections from the renal IM. Sections (b) and (c) are from approx. 1300 μm below the IM base. Unequal numbers of DTLs and ATLs reflect the prebend regions and AQP1-null DTLs. Scale bars: 100 μm. From Pannabecker and Dantzler (2006), used with permission.
Figure 6
Figure 6
Three-dimensional reconstruction showing spatial relationships of descending vasa recta (DVR; green tubules) and descending thin limbs (DTLs; red tubules) to collecting ducts (CDs; blue tubules) for a single CD cluster. DTL segments that do not express aquaporin-1 were identified by their expression of αB-crystallin and are shown in grey. DVR and DTLs are spatially separate from the CDs and panels (a)–(d) show that this relationship continues along the entire axial length of the CD cluster. Tubules in panels (a)–(d) have been rotated forwards approx. 2°. Axial positions of panels (a)–(d) are shown in panel (e) with lower case letters. Tubules are oriented in a corticopapillary direction, with the upper edge of the image near the base of the IM. Scale bar, 500 μm. From Pannabecker and Dantzler (2006), used with permission.
Figure 7
Figure 7
Five primary clusters making up a single secondary collecting duct (CD) cluster that consists of 31 CDs at the inner medulla (IM) base. Image taken from section at 400 μm below IM base. CD cluster boundaries (white) determined by Euclidean distance map technique. Descending thin limb/aquaporin-1 (magenta), CD/aquaporin-2 (blue), ascending thin limb/chloride channel ClC-K1 (green). Scalebar, 100 μm. From Pannabecker et al. (2008b), used with permission.
Figure 8
Figure 8
Five primary clusters making up a single secondary collecting duct (CD) cluster that consists of 31 CDs at the inner medulla (IM) base. Image taken from section at 400 μm below IM base. CD cluster boundaries (white) determined by Euclidean distance map technique. Descending vasa recta/urea transporter B (yellow), CD/aquaporin-2 (blue), ascending thin limb/chloride channel ClC-K1 (green). Scalebar, 100 μm. From Pannabecker et al. (2008b), used with permission.
Figure 9
Figure 9
Three-dimensional reconstruction showing spatial relationships of ascending vasa recta (AVR; red tubules) and ascending thin limbs (ATLs; green tubules) to collecting ducts (CDs; blue tubules) for the same CD cluster shown in Fig. 6. AVR and ATLs are distributed relatively uniformly outside of and within the CD cluster and panels (a)–(d) show that this relationship continues along the entire axial length of the CD cluster. Tubules in panels (a)–(d) have been rotated forwards approx. 20°. Axial positions of panels (a)–(d) are shown in panel (e) with lower case letters. Tubules are oriented in a corticopapillary direction, with the upper edge of the image near the base of the inner medulla. Scale bar, 500 μm. From Pannabecker and Dantzler (2006), used with permission.
Figure 10
Figure 10
Transverse section from near the base of the inner medulla (IM). (a) Inner medullary ascending vasa recta and capillaries (red) are symmetrically positioned around collecting ducts (CDs; blue) and make intimate contact with adjacent CDs. This relationship extends from the base of the IM to the tip of the papilla for most collecting ducts. Inner medullary urea transporter B-expressing descending vasa recta (green) tend to be distant from collecting ducts. (b) Diagrammatic representation of tubules and vessels to facilitate pattern analysis. Scalebar, 30 μm. From Pannabecker and Dantzler (2006), used with permission.
Figure 11
Figure 11
Three-dimensional reconstruction of single collecting duct segment (blue) with multiple ascending vasa recta (red) abutting it. Upper panel illustrates 90° axial rotation of segments shown in adjacent panels. Scalebar, 100 μm. From Pannabecker and Dantzler (2006), used with permission.
Figure 12
Figure 12
Electron micrographs showing transverse sections of collecting duct (CDs) and ascending vasa recta (AVR) from approx. 1.5 mm (panels a, b, d) and 4 mm (panel c) below the base of the inner medulla. (a) CD surrounded by four AVR (asterisks). Other tubular structures surrounding the CD are ascending thin limbs (ATLs). Interstitial nodal spaces are formed between CD, AVR and ATLs (marked with X). Scalebar, 10 μm. (b) AVR abuts CD with minimal direct contact. Scalebar, 1 μm. (c) AVR abuts CD with microvillus (arrow). IS, interstitium. Scalebar, 1 μm. (d) AVR abuts CD with microvilli (arrows). Scalebar, 1 μm. From Pannabecker and Dantzler (2006), used with permission.
Figure 13
Figure 13
Diagram of vasa recta architecture in the outer zone of the inner medulla (IM). The urea transporter B (UT-B)- positive descending vas rectum (green) descends along the corticopapillary axis. The UT-B-positive segment overlaps with PV-1 (red and green, small bracket) and is continuous with a descending PV-1-positive (fenestrated) extension (red, large bracket). The PV-1 extension is continuous with AVR1, which lie within the collecting duct (CD) cluster (intracluster region). AVR1 then connect to AVR1 in vascular bundles of the intercluster region. A number of AVR1 ascend directly from the outermost IM into the innermost inner stripe. Arrows denote blood flow direction. AVR1, intracluster AVR and interconnecting capillaries that do abut CDs; AVR2, intercluster fenestrated vessels that do not abut CDs, and do or do not abut descending vasa recta (DVR). AVR2a are a subset of AVR2 that do abut DVR (Yuan & Pannabecker 2010). From Kim and Pannabecker (2010), used with permission.
Figure 14
Figure 14
One single collecting duct (CD) in transverse section showing interstitial nodal spaces (marked with X) between CD, ascending vasa recta (AVR) and ascending thin limbs (ATLs) in a composite image of two sections 3 μm apart, from near the inner medullary base. CD (blue), AVR (red), ATL (green). Open space in wall of central CD is the location of an intercalated cell, which does not label for aquaporin-2. Scalebar, 10 μm. From Pannabecker and Dantzler (2006), used with permission.
Figure 15
Figure 15
Three-dimensional reconstruction of several papillary collecting ducts (CDs) (aquaporin-2; blue), ascending thin limbs (ATLs) (chloride channel ClC K-1; green), and aquaporin- 1 (AQP1)-null descending thin limbs DTLs (αB-crystallin, yellow). Papillary surface epithelium is shown in grey. Tight narrow bends of loops of Henle (3 upper arrows) and wide transverse bends of loops of Henle (2 lower arrows) are shown. Wide transverse bends of two loops reaching to near the tip of the papilla almost completely encompass a final CD segment (blue) prior to its merging with the papillary wall (surface epithelium; translucent grey) to form a duct of Bellini. Relative diameters of loops and CDs in this image nearly approximate true dimensions. Scalebar, 200 μm. From Pannabecker and Dantzler (2007), used with permission.
Figure 16
Figure 16
Cumulative loop of Henle bend surface area-to-collecting duct (CD) surface area ratio for all loops (including for each loop the area from the start of the prebend to an equal axial distance on the ascending thin limb). Ratios were determined at 5 μm intervals throughout the final 500 μm of the inner medulla (inner zone 2). This was first done for all native loops (wide-bend plus narrow-bend; open squares). Wide-bend loops were then converted into equivalent narrow-bend loops as described in Pannabecker et al. (2008b), and their three-dimensional surface area was determined. The cumulative loop surface area-to-CD surface area ratio was then computed for all converted wide-bend loops plus all native narrow-bend loops (solid triangles). From Pannabecker et al. (2008b), used with permission.
Figure 17
Figure 17
Schematic diagram of a cross section through the upper inner medulla (IM) (outer zone 1; a), mid-IM (outer zone 2; b) and deep IM (inner zone; c) showing concentric regions and relative positions of tubules and vessels. Decimal numbers in (a) indicate relative interaction weightings with regions. R1 represents intracluster region; R2 represents intercluster region. DTLS and ATLS are descending and ascending thin limbs of long loop of Henle that turns within the first 1.0 mm (outer zone 1) of the IM; DTLM and ATLM are descending and ascending thin limbs of long loop of Henle that turns within the mid-IM (outer zone 2); DTLL and ATLL are descending and ascending thin limbs of long loop of Henle that reaches into the deep IM (inner zone). CD, collecting duct; DVR, descending vas rectum; AVR1, ascending vas rectum within intracluster region; AVR2, ascending vas rectum within intercluster region. From Layton et al. (2010), used with permission.

Similar articles

Cited by

References

    1. Atherton JC, Green R, Thomas S. Influence of lysine-vasopressin in dosage on the time course of changes in renal tissue and urinary composition in the conscious rat. Am J Physiol. 1971;213:291–309. - PMC - PubMed
    1. Beck F, Dorge A, Rick R, Thurau K. Osmoregulation of renal papillary cells. Pflugers Arch. 1985;405:S28–S32. - PubMed
    1. Bulger RE, Trump BF. Fine structure of the rat renal papilla. Am J Anat. 1966;118:685–722. - PubMed
    1. Burg MB, Green N. Function of thick ascending limb of Henle’s loop. Am J Physiol. 1973;224:659–668. - PubMed
    1. Chou CL, Knepper MA. In vitro perfusion of chinchilla thin limb segments: segmentation and osmotic water permeability. Am J Physiol Renal, Fluid Electrolyte Physiol. 1992;263:F417–F426. - PubMed

Publication types