

Diffusion tensor imaging correlates with cytopathology in a rat model of neonatal hydrocephalus
- PMID: 21054844
- PMCID: PMC2989304
- DOI: 10.1186/1743-8454-7-19
Diffusion tensor imaging correlates with cytopathology in a rat model of neonatal hydrocephalus
Abstract
Background: Diffusion tensor imaging (DTI) is a non-invasive MRI technique that has been used to quantify CNS abnormalities in various pathologic conditions. This study was designed to quantify the anisotropic diffusion properties in the brain of neonatal rats with hydrocephalus (HCP) and to investigate association between DTI measurements and cytopathology.
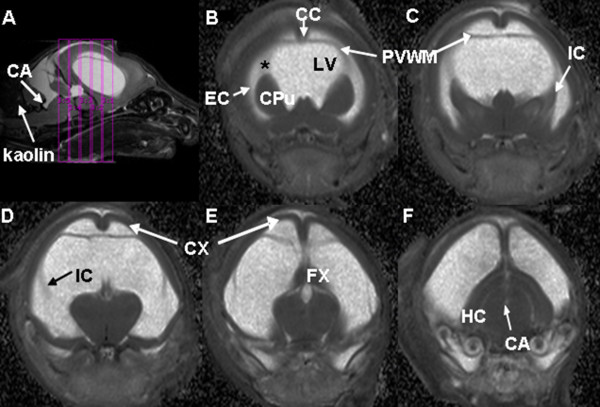
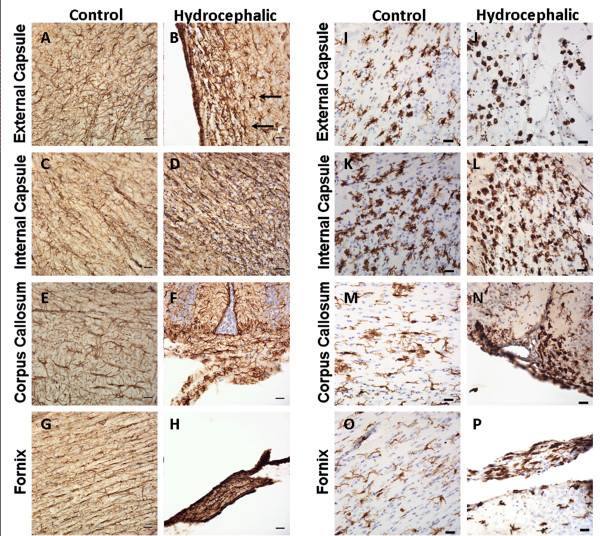
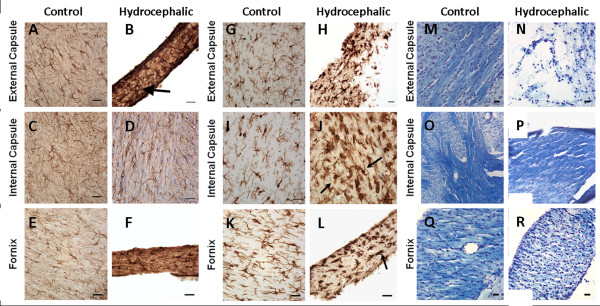
Methods: DTI data were acquired between postnatal day 7 (P7) and P12 in 12 rats with HCP induced at P2 and in 15 age-matched controls. Animals were euthanized at P11 or P22/P23 and brains were processed with immunohistochemistry for glial fibrillary acidic protein (GFAP), ionized calcium-binding adaptor molecule (Iba-1), and luxol fast blue (LFB) to assess astrocytosis, microglial reactivity and degree of myelination, respectively.
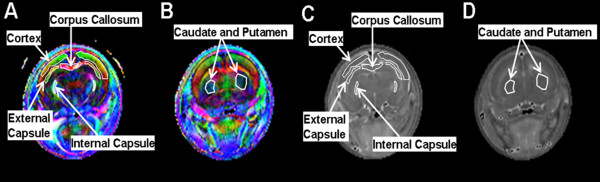
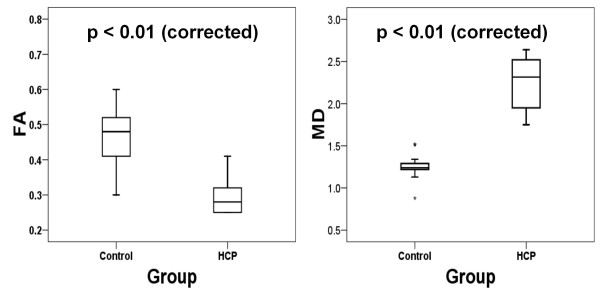
Results: Hydrocephalic rats were consistently found to have an abnormally low (at corrected p-level of <0.05) fractional anisotropy (FA) value and an abnormally high mean diffusivity (MD) value in the cerebral cortex (CX), the corpus callosum (CC), and the internal capsule (IC). Immunohistochemical analysis demonstrated trends of increasing astrocyte and microglial reactivity in HCP rats at P11 that reached statistical significance at P22/P23. A trend toward reduced myelination in the HCP rats was also found at P22/P23. Correlation analysis at P11 for the CC demonstrated statistically significant correlations (or trends) between the DTI measurement (the decreased FA and increased MD values) and the GFAP or Iba-1 rankings. The immunohistochemical rankings in the IC at P22/P23 were also significantly correlated or demonstrated a trend with both FA and MD values.
Conclusions: This study demonstrates the feasibility of employing DTI on the brain in experimental hydrocephalus in neonatal rats and reveals impairments in multiple regions of interest in both grey and white matter. A strong correlation was found between the immunohistochemical results and the changes in anisotropic diffusion properties.
Figures
Similar articles
-
Diffusion tensor imaging study of pediatric patients with congenital hydrocephalus: 1-year postsurgical outcomes.J Neurosurg Pediatr. 2016 Sep;18(3):306-19. doi: 10.3171/2016.2.PEDS15628. Epub 2016 May 20. J Neurosurg Pediatr. 2016. PMID: 27203134 Free PMC article.
-
Diffusion tensor imaging of white matter injury in a rat model of infantile hydrocephalus.Childs Nerv Syst. 2012 Jan;28(1):47-54. doi: 10.1007/s00381-011-1590-y. Epub 2011 Oct 13. Childs Nerv Syst. 2012. PMID: 21994049
-
The role of diffusion tensor imaging and fractional anisotropy in the evaluation of patients with idiopathic normal pressure hydrocephalus: a literature review.Neurosurg Focus. 2016 Sep;41(3):E12. doi: 10.3171/2016.6.FOCUS16192. Neurosurg Focus. 2016. PMID: 27581308 Review.
-
Anisotropic diffusion properties in infants with hydrocephalus: a diffusion tensor imaging study.AJNR Am J Neuroradiol. 2009 Oct;30(9):1792-8. doi: 10.3174/ajnr.A1663. Epub 2009 Aug 6. AJNR Am J Neuroradiol. 2009. PMID: 19661167 Free PMC article.
-
White matter mean diffusivity correlates with myelination in tuberous sclerosis complex.Ann Clin Transl Neurol. 2019 Jul;6(7):1178-1190. doi: 10.1002/acn3.793. Epub 2019 Jun 23. Ann Clin Transl Neurol. 2019. PMID: 31353853 Free PMC article.
Cited by
-
Diffusion tensor imaging study of pediatric patients with congenital hydrocephalus: 1-year postsurgical outcomes.J Neurosurg Pediatr. 2016 Sep;18(3):306-19. doi: 10.3171/2016.2.PEDS15628. Epub 2016 May 20. J Neurosurg Pediatr. 2016. PMID: 27203134 Free PMC article.
-
Reactive astrocytosis in feline neonatal hydrocephalus: acute, chronic, and shunt-induced changes.Childs Nerv Syst. 2011 Dec;27(12):2067-76. doi: 10.1007/s00381-011-1552-4. Epub 2011 Aug 17. Childs Nerv Syst. 2011. PMID: 21847645
-
Changes in Rat Brain Tissue Microstructure and Stiffness during the Development of Experimental Obstructive Hydrocephalus.PLoS One. 2016 Feb 5;11(2):e0148652. doi: 10.1371/journal.pone.0148652. eCollection 2016. PLoS One. 2016. PMID: 26848844 Free PMC article.
-
Fractional anisotropy from diffusion tensor imaging correlates with acute astrocyte and myelin swelling in neonatal swine models of excitotoxic and hypoxic-ischemic brain injury.J Comp Neurol. 2021 Jul 1;529(10):2750-2770. doi: 10.1002/cne.25121. Epub 2021 Feb 15. J Comp Neurol. 2021. PMID: 33543493 Free PMC article.
-
Feasibility of fast brain diffusion MRI to quantify white matter injury in pediatric hydrocephalus.J Neurosurg Pediatr. 2019 Jul 19;24(4):461-468. doi: 10.3171/2019.5.PEDS18596. Print 2019 Oct 1. J Neurosurg Pediatr. 2019. PMID: 31323624 Free PMC article.
References
LinkOut - more resources
Full Text Sources
Miscellaneous
