. 2010 Nov 23;20(22):2052-7.
doi: 10.1016/j.cub.2010.10.025. Epub 2010 Nov 4.

Synchronized neural input shapes stimulus selectivity in a collision-detecting neuron

Affiliations

Synchronized neural input shapes stimulus selectivity in a collision-detecting neuron

Peter W Jones et al. Curr Biol. .

Abstract

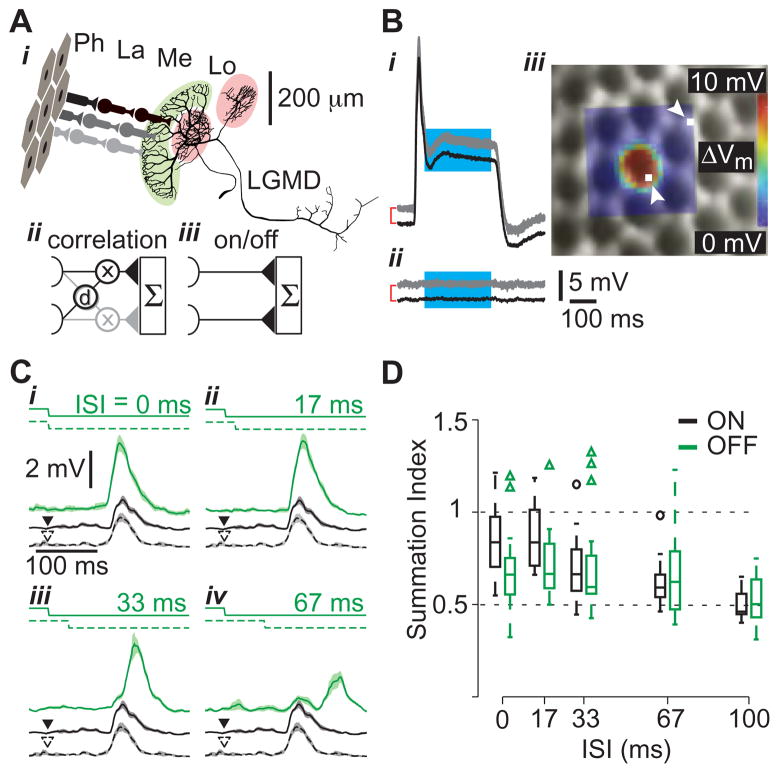
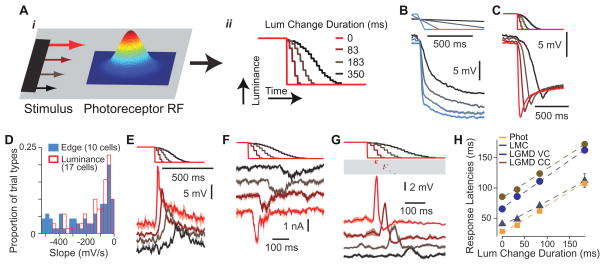
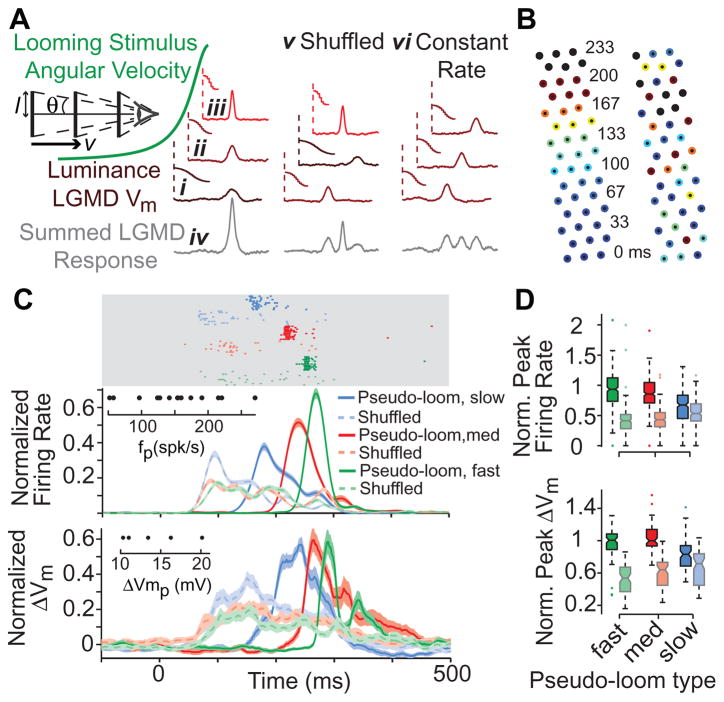
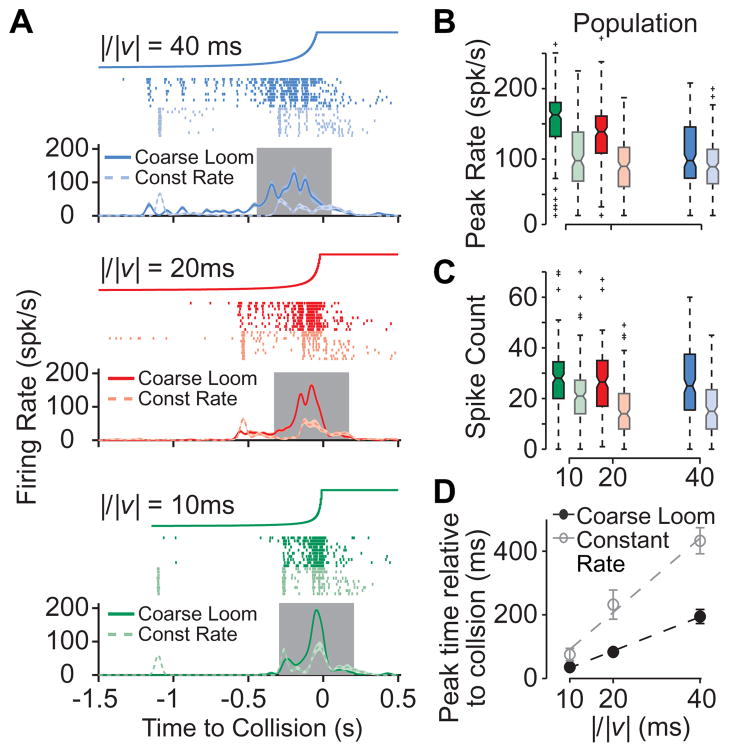
How higher-order sensory neurons generate complex selectivity from their simpler inputs is a fundamental question in neuroscience. The lobula giant movement detector (LGMD) is such a visual neuron in the locust Schistocerca americana that responds selectively to objects approaching on a collision course or their two-dimensional projections, looming stimuli [1-4]. To study how this selectivity arises, we designed an apparatus allowing us to stimulate, individually and independently, a sizable fraction of the ∼15,000 elementary visual inputs impinging retinotopically onto the LGMD's dendritic fan [5-7] (Figure 1Ai). We then recorded intracellularly in vivo throughout the visual pathway, assessing the LGMD's activity and that of all three successive presynaptic stages conveying local excitatory inputs. Our results suggest that as collision becomes increasingly imminent, the strength of these inputs increases, whereas their latency decreases. This latency decrease favors summation of inputs activated sequentially throughout the looming sequence, making the neuron maximally sensitive to collision-bound trajectories. Thus, the LGMD's selectivity arises partially from presynaptic mechanisms that synchronize a large population of inputs during a looming stimulus and subsequent detection by postsynaptic mechanisms within the neuron itself. Analogous mechanisms are likely to underlie the tuning properties of visual neurons in other species as well.


Figures

Figure 1
Figure 1. Probing motion detection mechanisms using visual stimuli with single facet resolution
A i Excitatory neural circuitry presynaptic to the LGMD. Photoreceptors (Ph), located within ommatidia (facets), synapse on cells in the lamina (La), which in turn contact medullary neurons (Me) that synapse onto the LGMD in the lobula (Lo). These inputs impinge on LGMD’s large dendritic fan (highlighted in light green) while two separate dendritic fields receive inhibitory inputs (light red; scale bar applies to LGMD only). The correlation diagram (ii) illustrates hypothetical delay (d) and multiply (x) interactions between adjacent LGMD inputs (one input in black, the other gray), in contrast to independent input channels (iii). Both models include summation (Σ) in the LGMD. B Single photoreceptor responses (gray, n=3 trials) and mean (black) to a 5×5 μm stimulus positioned on a visually identified ommatidium (i) and beside one (ii). For clarity, the mean responses have been shifted vertically (red brackets, subsequent offsets left unmarked). iii Receptive field (RF) of a photoreceptor, mapped using a 20×20 location grid, superimposed on the simultaneously acquired microscopic image of the eye lattice. White squares, indicated by arrowheads, show the stimulation locations corresponding to the traces in i and ii. The RF was constructed by averaging over the cyan section of the traces in i and ii. The diameter of an ommatidium is ~25 μm. C LGMD responses to apparent motion stimuli. Two adjacent facets were stimulated by a luminance step decrease with varying inter-stimulus intervals (ISIs; top solid and dashed lines in i-iv). The LGMD response is illustrated below the stimulus in green (median filtered, mean response and SEM, n= 9–10 trials). Responses to stimulation of each facet in isolation are shown as black solid and dashed lines (arrowheads indicate stimulus onset). Only OFF responses are shown. D Distributions of summation indices as a function of ISI are shown as box plots, with ON responses in black and OFF responses in green (n = 26 facet pairs in 9 locusts). For each box, the central line indicates the median, the lower and upper boundaries are the 25th and 75th percentiles and the whiskers indicate the extent of the data (outliers marked by circles and triangles, respectively).
Figure 2
Figure 2. Single facet signaling of stimulus speed
A Model of velocity encoding by single photoreceptors. As a dark object crosses the Gaussian shaped receptive field (i), it produces a luminance change whose duration depends on stimulus speed (ii). Luminance change durations are those employed in C, E, F and G. Luminance steps occur at the refresh rate of the display. B Photoreceptor response to a translating dark edge moving at various speeds (20, 80, 319, and 1275 º/s). Top lines show edge position over time (maximal displacement 102º). Lines at bottom are mean responses with SEM envelopes (n = 8 trials). C Photoreceptor responses to single facet microscopic luminance modulation. The top stimulus traces show the luminance change over time, and the correspondingly colored traces below show the resulting photoreceptor responses. D Distribution of photoreceptor response slopes (calculated from 20 to 80% of the peak response) evoked by edge motion (blue; 20–1275 º/s, contrast: 0.96; 10 cells) and single facet luminance changes (red, outlined; transition duration: 1–517 ms; 17 cells). E Large monopolar cell (LMC) responses to similar luminance changes as in panel C (n=2–4 trials). F LGMD responses (Im) to single facet luminance changes under voltage clamp (VC) at resting potential (−64 mV, n=5 trials). G LGMD responses to single facet luminance changes under current clamp (CC). The membrane potential (Vm) traces at the bottom have been median filtered to remove spikes prior to averaging (n = 6–7 trials). The rasters above report the timing of those spikes. H Peak LGMD and LMC response times, and photoreceptor response onset time (20% of peak) as a function of luminance change duration. Dashed lines show least squares linear fits, with slopes of 0.46, 0.40, 0.52, 0.49 and intercepts of 25, 37, 66 and 84 ms for photoreceptors, LMCs and the LGMD (Im and Vm) respectively. The 95% confidence intervals on the fitted slopes were ±0.01, ±0.08, ±0.06, and ±0.08. Error bars denote SEM (photoreceptors, n = 91–100 trials; LMCs, n = 39–42; LGMD VC, n = 115–121; LGMD CC, n = 133–137).
Figure 3
Figure 3. Temporal synchronization of LGMD excitation by accelerating sequences of luminance changes
A Temporal synchronization hypothesis and tests. The accelerating angular velocity of a looming stimulus (green) stimulates successive facets with increasingly rapid changes in luminance, leading to decreasing response latencies (i-iii; luminance/response pairs connected by vertical dashed lines). This sequence synchronizes excitatory inputs, resulting in strong LGMD responses (iv). Shuffled (v) and Constant Rate (vi) columns show stimulus manipulations used to disrupt this synchronization, by either shuffling the order of presentation, or by keeping the rates of single facet luminance changes constant. l: stimulus half-size, v: approach velocity, θ: half-angle subtended at the eye. B Stimulus positions used to independently target 45 facets in a pseudo-looming experiment. The numbers denote the luminance change onset times (in ms) for alternate rows of facets, while the color indicates its duration from long (cold colors) to short (hot colors; black is an instantaneous change). Left array shows pseudo-looming, with a coherent activation sequence from bottom to top (slow pseudo-loom condition); right array is corresponding shuffled condition. C LGMD responses to three pseudo-looms (slow, medium and fast) and the corresponding shuffled stimuli. The top rasters (light gray area) show spiking responses in one representative experiment. The traces below show normalized instantaneous firing rates (spike trains convolved with a Gaussian filter, σ=20 ms), for the recorded sample of LGMD neurons (16 animals, n=187–202 trials/condition). For each animal, single trial responses were normalized to the maximum, trial-averaged peak firing rate. The bottom traces show the normalized (as above), median filtered membrane potential in the subset of neurons for which we obtained intracellular recordings (5 animals, n=45–49 trials/condition). All traces and envelopes indicate mean and SEM. Insets show the distribution of peak firing rate (fp) and membrane potential change (ΔVmp) values used for normalization. D Box plots showing the distributions of normalized peak firing rates and normalized peak membrane potential changes. Pseudo-looming/shuffled pairs of all types have significantly different median peak firing rates (pRS<10−4) and peak membrane potential changes (pRS<0.003), as indicated by non-overlapping notches in box plots.
Figure 4
Figure 4. LGMD responses to modified looming stimuli
A LGMD responses to “coarse” and “constant rate” looming stimuli in a representative single experiment. Top traces show the stimulus angular size over time of the corresponding looming stimulus (final full angle: 85º). Rasters show LGMD spikes in each trial for coarse (saturated color) and constant rate looming (lighter color) stimuli. Correspondingly colored traces below show mean firing rates. Gray area indicates the 500 ms window centered on the LGMD peak firing rate in which spike counts were tabulated. B, C Box plots, formatted and colored as in Figure 3, showing the distributions of peak firing rates and spike counts for all trials pooled across the population of experiments (12 animals, n=118–122 trials/condition). Looming stimulus type had a significant effect on the peak firing rate, and the firing rates for constant rate looming were significantly lower than those for coarse looming, for all l/|v| values (pKW = 10−20-10−5, pHSD<0.05). D Timing of the peak firing rate as a function of l/|v| for coarse looming (black) and constant rate looming (gray) stimuli. Plotted circles are population mean times, with error bars indicating SEM. Dashed lines show linear fits to the data, with slopes of 5.3 and 11.7 and intercepts of −20 and −19 ms for looming and constant rate stimuli, respectively.

Similar articles

Cited by

References

    1. Schlotterer GR. Response of the locust descending movement detector neuron to rapidly approaching and withdrawing visual stimuli. Can J Zool. 1977;55:1372–1376.
    1. Rind FC, Simmons PJ. Orthopteran DCMD neuron: a reevaluation of responses to moving objects. I. Selective responses to approaching objects. J Neurophysiol. 1992;68:1654–1666. - PubMed
    1. Hatsopoulos N, Gabbiani F, Laurent G. Elementary computation of object approach by a wide-field visual neuron. Science. 1995;270:1000–1003. - PubMed
    1. Simmons PJ, Rind FC. Orthopteran DCMD neuron: a reevaluation of responses to moving objects. II. Critical cues for detecting approaching objects. J Neurophysiol. 1992;68:1667–1682. - PubMed
    1. Strausfeld NJ, Nässel DR. Neuroarchitectures serving compound eyes of crustacea and insects. In: Autrum H, editor. Comparative physiology and evolution of vision of invertebrates, B: Invertebrate visual centers and behavior I, Handbook of sensory physiology. Vol. 7. Berlin: Springer Verlag; 1981. pp. 1–132.

Publication types

LinkOut - more resources