. 2011 Feb;41(2):508-27.
doi: 10.1016/j.nbd.2010.10.023. Epub 2010 Nov 5.

Reactive astrocytes and Wnt/β-catenin signaling link nigrostriatal injury to repair in 1-methyl-4-phenyl-1,2,3,6-tetrahydropyridine model of Parkinson's disease

Affiliations

Reactive astrocytes and Wnt/β-catenin signaling link nigrostriatal injury to repair in 1-methyl-4-phenyl-1,2,3,6-tetrahydropyridine model of Parkinson's disease

F L'Episcopo et al. Neurobiol Dis. 2011 Feb.

Erratum in

  • Neurobiol Dis.2011 Jun;42(3):539

Abstract

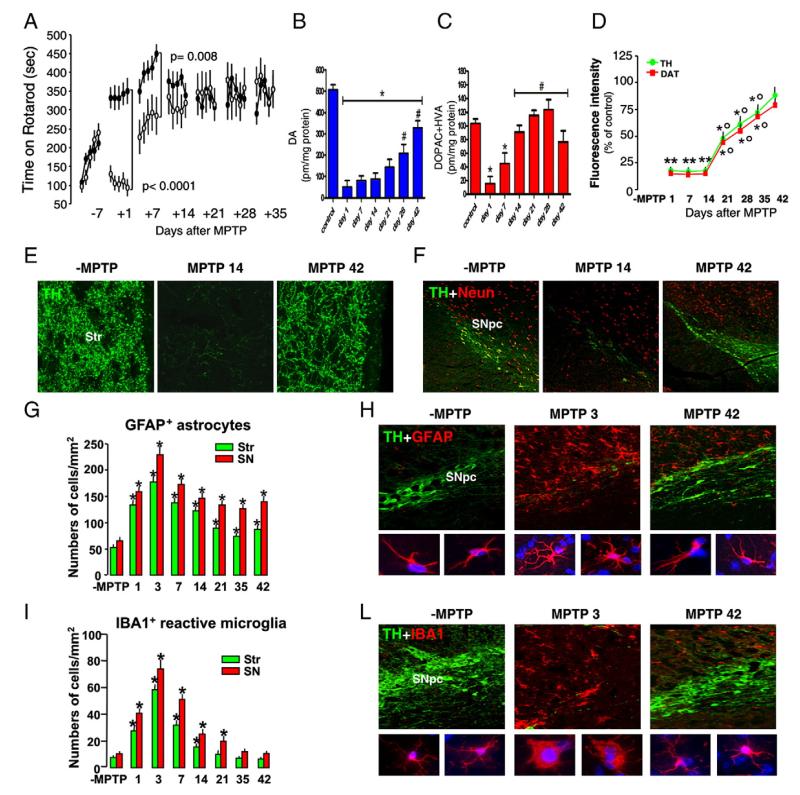
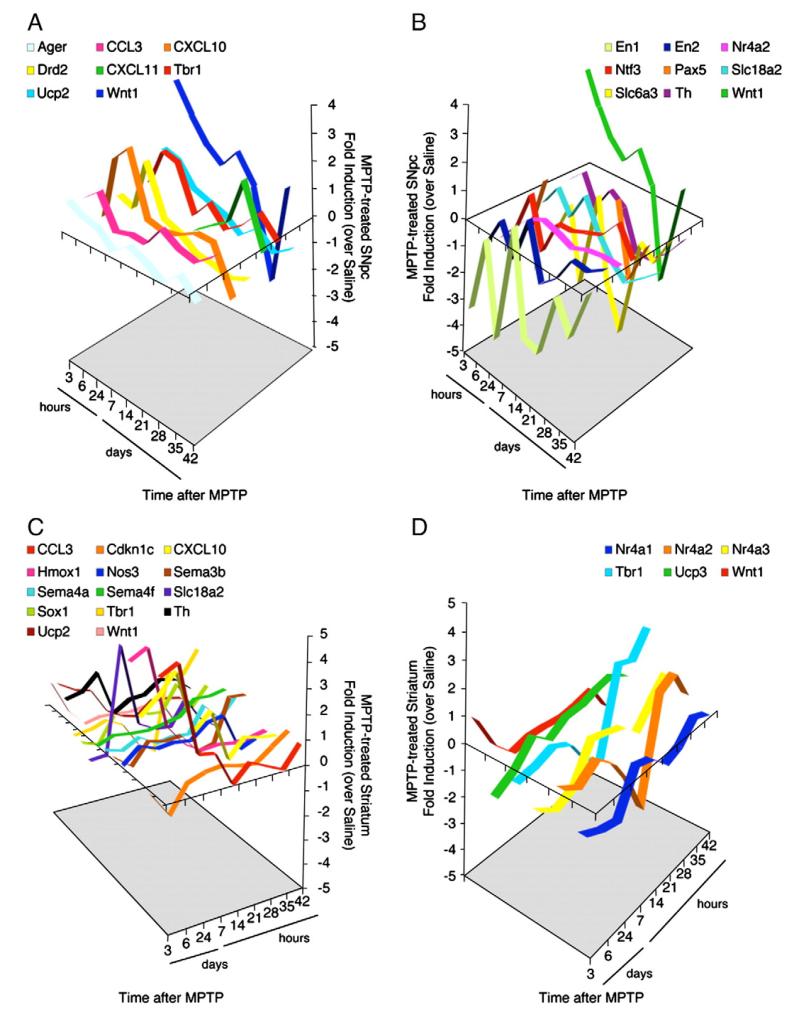
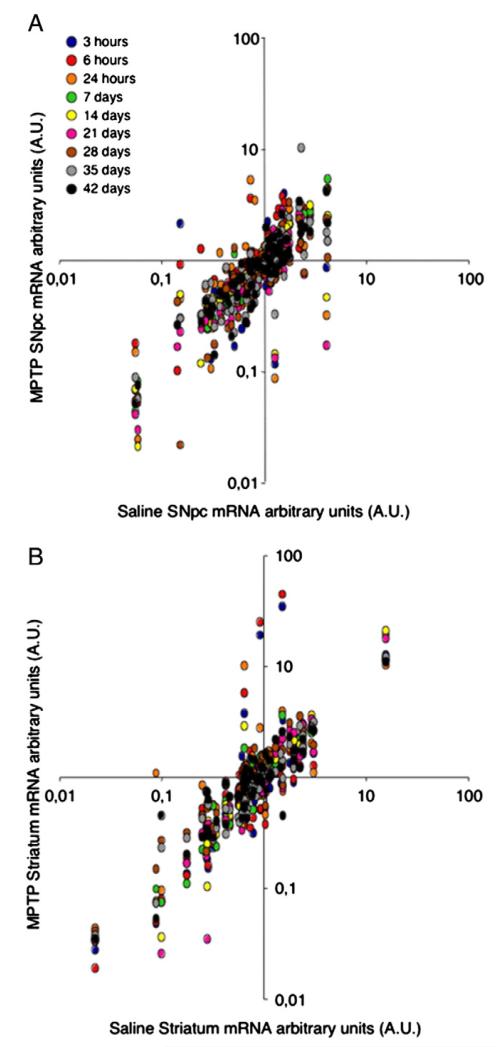
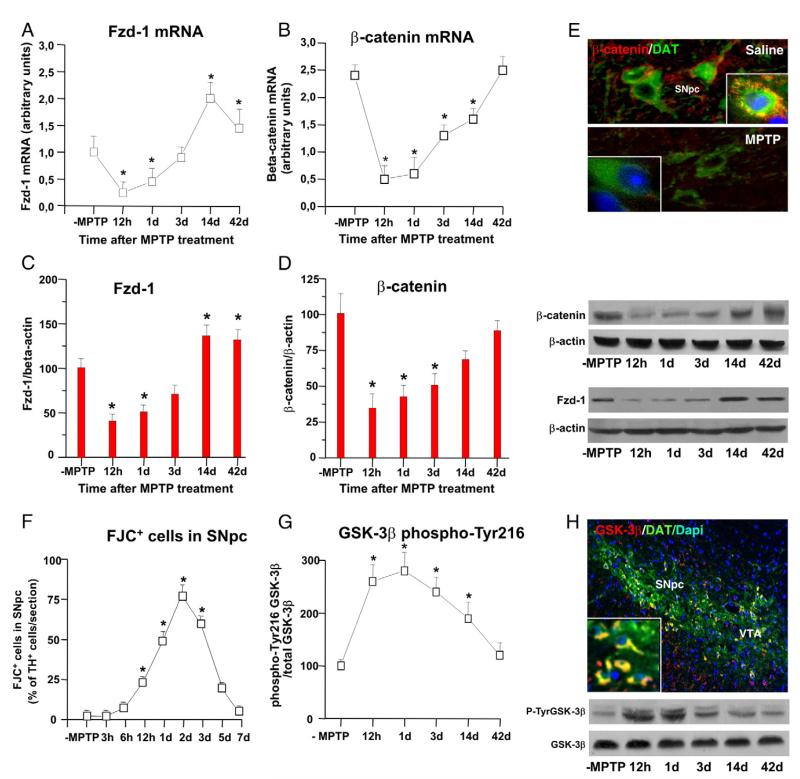
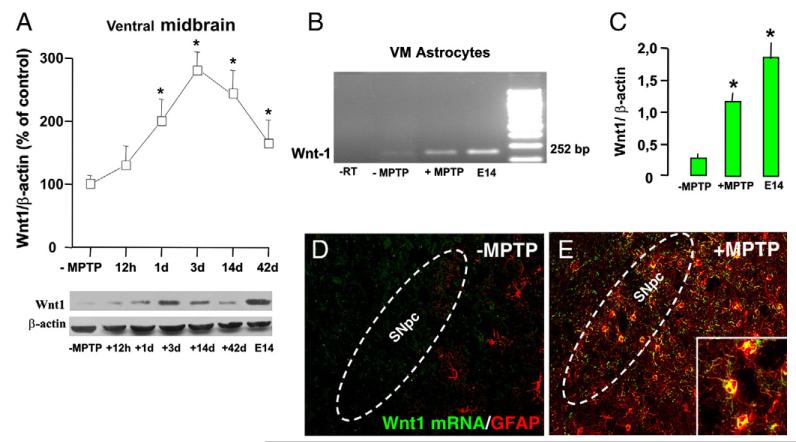
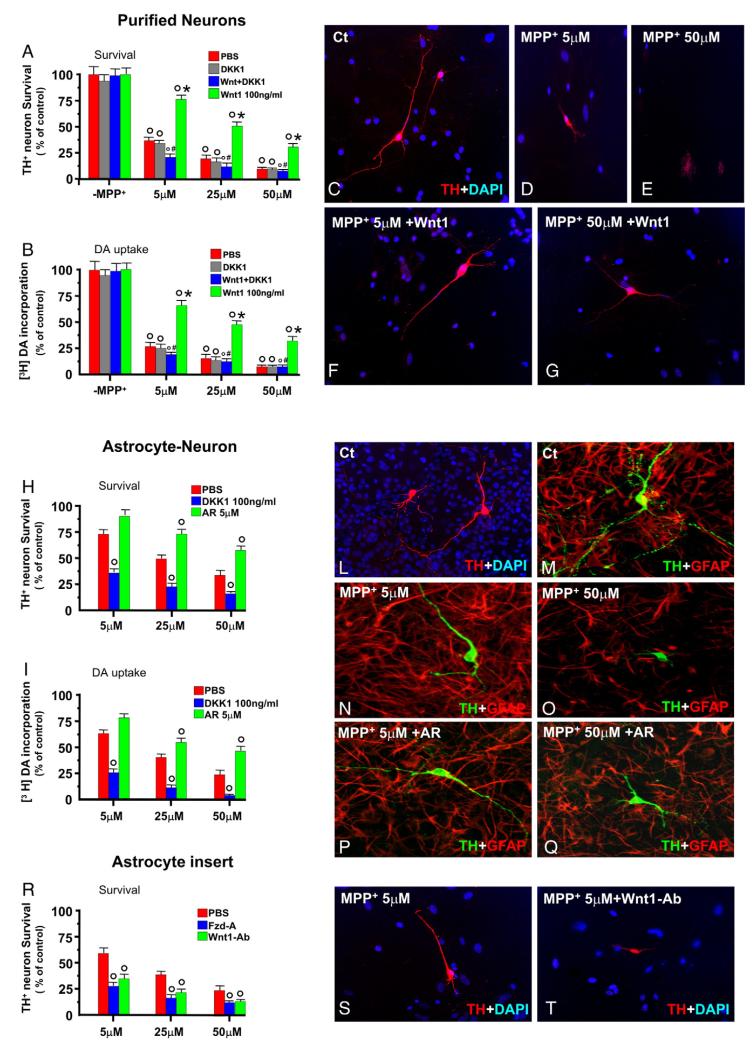
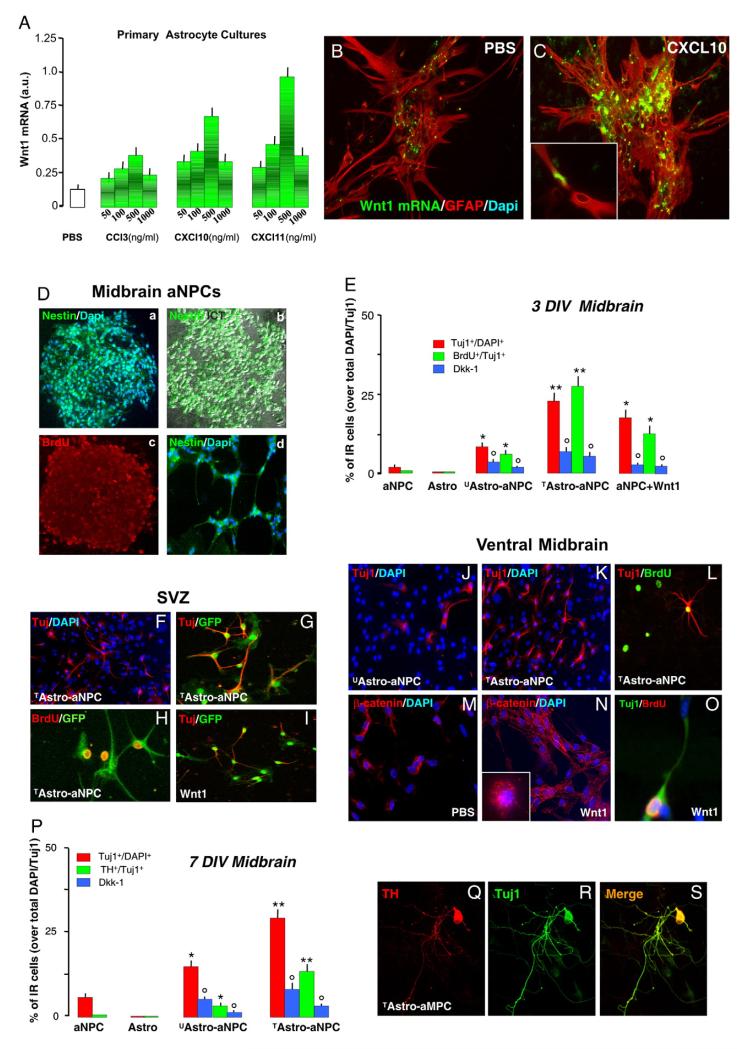
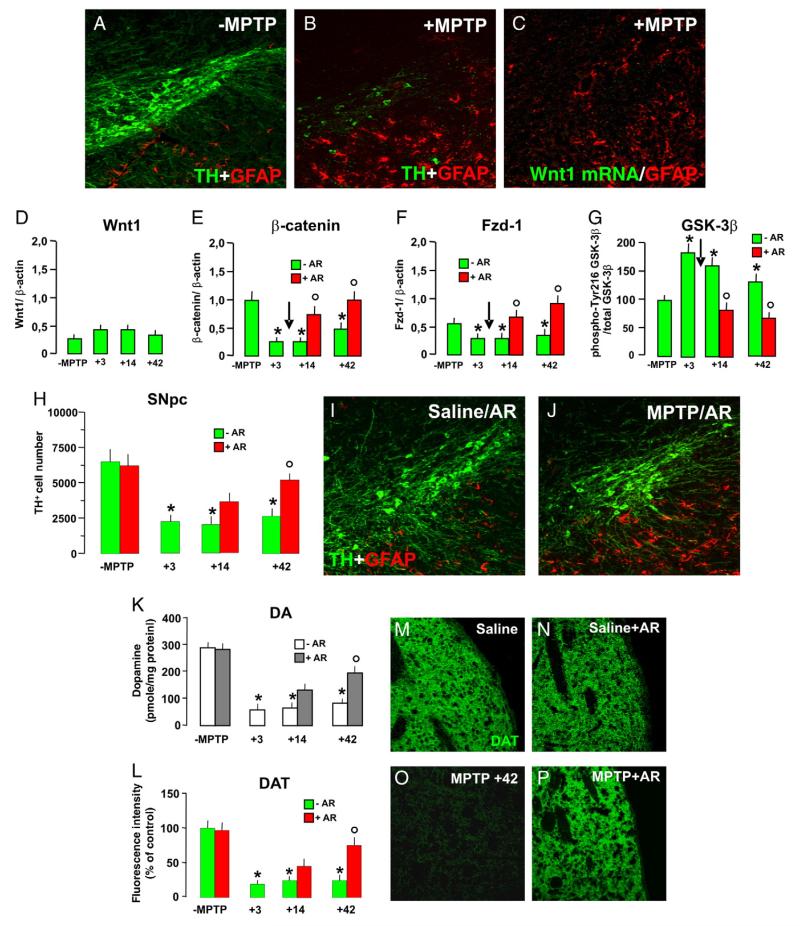
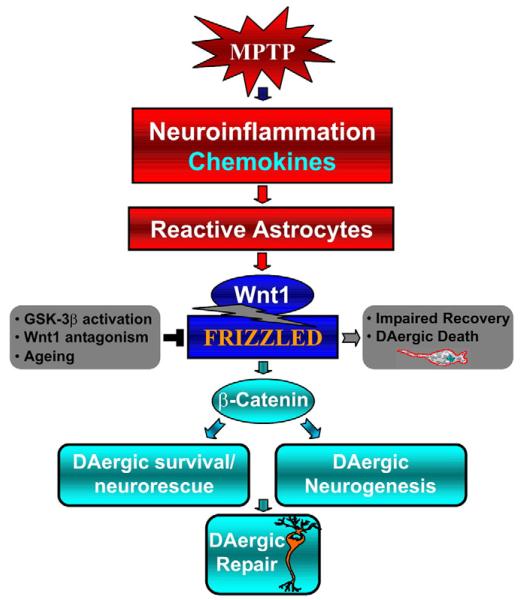
Emerging evidence points to reactive glia as a pivotal factor in Parkinson's disease (PD) and 1-methyl-4-phenyl-1,2,3,6-tetrahydropyridine (MPTP)-lesioned mouse model of basal ganglia injury, but whether astrocytes and microglia activation may exacerbate dopaminergic (DAergic) neuron demise and/or contribute to DAergic repair is presently the subject of much debate. Here, we have correlated the loss and recovery of the nigrostriatal DAergic functionality upon acute MPTP exposure with extensive gene expression analysis at the level of the ventral midbrain (VM) and striata (Str) and found a major upregulation of pro-inflammatory chemokines and wingless-type MMTV integration site1 (Wnt1), a key transcript involved in midbrain DAergic neurodevelopment. Wnt signaling components (including Frizzled-1 [Fzd-1] and β-catenin) were dynamically regulated during MPTP-induced DAergic degeneration and reactive glial activation. Activated astrocytes of the ventral midbrain were identified as candidate source of Wnt1 by in situ hybridization and real-time PCR in vitro. Blocking Wnt/Fzd signaling with Dickkopf-1 (Dkk1) counteracted astrocyte-induced neuroprotection against MPP(+) toxicity in primary mesencephalic astrocyte-neuron cultures, in vitro. Moreover, astroglial-derived factors, including Wnt1, promoted neurogenesis and DAergic neurogenesis from adult midbrain stem/neuroprogenitor cells, in vitro. Conversely, lack of Wnt1 transcription in response to MPTP in middle-aged mice and failure of DAergic neurons to recover were reversed by pharmacological activation of Wnt/β-catenin signaling, in vivo, thus suggesting MPTP-reactive astrocytes in situ and Wnt1 as candidate components of neuroprotective/neurorescue pathways in MPTP-induced nigrostriatal DAergic plasticity.


Figures

Fig. 1
Fig. 1
MPTP-induced injury and spontaneous recovery of nigrostriatal DAergic endpoints and glia activation. (A) Motor performances on Rotarod of saline- (black dots) and MPTP-treated (white dots) mice (n=10/group). Time of permanence on revolving bars (ordinate) is plotted against pre- and post-treatment days (5 trials/day) during which experiments were performed. Mean and SEM values are reported. Establishment of a motor deficit (1–7 dpt) is followed by recovery from motor impairment by 14 dpt. (B–C) HPLC analysis of dopamine (B), its metabolites DOPAC + HVA (C) in the striatum (Str) of saline and MPTP mice (n=6/time point). Differences were analyzed by ANOVA followed by Newman–Keuls test and considered significant when p<0.05. (B) *vs. saline; #vs. 1–14 dpt; (C) *vs. saline; #vs. 1dpt. (D) TH and DAT-IR in striatum (Str) assessed by immunofluorescent staining and image analysis by confocal laser microscopy in saline and MPTP mice (n=6/time point). Fluorescence intensity values (FI, means ± SEM) are expressed as percent (%) of saline. **p<0.05 vs. ct, °p<0.05 vs. 1–14 dpt. (E) Representative confocal images show loss TH-IF (revealed by FITC, green) in Str of MPTP mice at 14 days and a substantial recovery of TH-IF by 42 dpt. (F) DAergic cell bodies in SNpc. Representative confocal images of dual staining with TH+ and NeuN + of coronal midbrain sections at the level of the SNpc showing the recognized loss of TH+ NeuN +cell bodies 14 dpt and a partial recovery observed by 42 dpt. (G, I) Astrocyte and microglial cell numbers at different time intervals after saline and MPTP injection (n=4/experimental group) in Str and SNpc. (H) Representative confocal images of dual staining with GFAP+ (red) and TH (green) in saline, 3 and 42 dpt. (L) Representative confocal images of dual staining with IBA1+ (red) and TH (green) in SNpc. Nuclei are counterstained with DAPI (blue, insets). Differences were analyzed by ANOVA followed by Newman–Keuls test and considered significant when p<0.05. **p<0.05 vs. saline.
Fig. 2
Fig. 2
MPTP administration induces expression of pro-inflammatory chemokines, DA transporters, neurogenic patterning factors, and homeobox genes responsible for survival and identity of telencephalic precursor cells in both ventral midbrain (containing the SNpc) (A–B) and striatum (C–D). Groups of 6 mice/time interval received intraperitoneal injections of MPTP–HCl, 20 mg/kg, 4 times in a day at 2-h intervals. Mice were sacrificed on the indicated days after MPTP treatment. Real-time PCR was used for semi-quantitative analysis of selected mRNAs. In SNpc, 8 selected genes showed significant (fold induction≥ 1) upregulation (A) and 9 selected genes significant (fold induction≤−1) downregulation (B) at any time point in comparison to saline-treated controls. Wnt1 gene resulted upregulated up to day 21, and from day 35 to day 42, but downregulated from day 21 to day 35. In the striatum, 14 selected genes showed significant upregulation (C) and 6 selected genes significant downregulation (D) at any time point in comparison to saline-treated controls. Wnt1 was downregulated, with the exception of 3-h time point.
Fig. 3
Fig. 3
Systemic administration of MPTP induces pro-inflammatory chemokines, DA transporters, and neurogenic transcription factors in the SNpc and corpus striatum at mRNA level. Bivariate scatter plot analysis of gene expression levels of 96b format TaqMan® low-density-based array (TLDA) performed onto acutely dissociated SNPc (A) and striatum (B) from MPTP-treated mice (y-axis) compared to saline-treated controls (x-axis). Differences in gene expression were seen in the SNpc of MPTP-treated mice starting at 3 and 6 h and peaking at 24 h post-MPTP (r2=0.38; r2=0.54 and r2=0.15, respectively), when compared to 7 and 42 days post-MPTP (r2=0.90 and r2=0.70, respectively). In the striata, differences were seen in MPTP-treated mice again starting at 3 h post-MPTP and peaking at 6 h post-MPTP (r2=0.10 and r2=0.05, respectively), then slightly recovering at 24 h post-MPTP (r2=0.46), when compared to time points at which differences in striatal gene expression were only minor, such as from 7 days post-MPTP on (r2=0.97) Data are expressed as mRNA arbitrary units (AU) over whole adult healthy mouse brain.
Fig. 4
Fig. 4
MPTP-induced dynamic changes in Wnt signaling components during DAergic degeneration and glial activation. (A–B) Temporal analysis of Fzd-1 and β-catenin mRNA expression in the VM of saline and MPTP mice (n=4/group) was carried out by real-time quantitative PCR performed using TaqMan™ Assay Reagents on an Step One Detection System (Applied Biosystems) according to manufacturer’s protocol with specific primers for Fzd-1 receptor (assay ID: Mm00445405_s1) and β-catenin (ID: Mm00483039-m1). The housekeeping gene, β-actin, was used as normalizer and embrionic mouse brain as calibrator. Results are expressed as arbitrary units (AU) and represent mRNA levels detected in VM tissue samples from saline (-MPTP) and 12 h, 1, 3, 14, and 42 dpt. *p<0.05 vs. -MPTP. (C–D) Temporal analysis of Fzd-1 and β-catenin protein levels within the VM of saline and MPTP-treated mice (n=4/time point) by Western blot (wb), showing comparable downregulation of Fzd-1 and β-catenin starting 12 hpt, whereas a gradual trend towards a recovery is observed from 3 dpt on. Data from the experimental bands were normalized to beta-actin, and values were expressed as percent (%) of saline-injected controls. *p<0.05 vs. -MPTP. (E) Dual staining with β-catenin and the dopamine transporter, DAT, in the SNpc showing loss of β-catenin-IR signal 1 day post-MPTP, as opposed to β-catenin-IR signal localized abundantly beneath the cell nucleus of saline-injected controls. (F) Degeneration of SNpc neurons. The total number of Fluorojade C (FJC)-stained cells in SNpc was calculated for each side, averaged for each animal (n=4/time point) and normalized to the number of TH+ neurons in SNpc per section. *p<0.05 vs. -MPTP. (G) Active GSK-3β (GSK-3β phospho-Tyr216) protein levels (n=4/time point) as determined by wb are maximally upregulated by 12 h–3dpt, paralleling DAergic degeneration (D). Data from the experimental bands were normalized to beta-actin, as above, values expressed as percent (%) of saline-injected controls. *p<0.05 vs. -MPTP. (G) Dual staining with GSK-3β and DAT indicated a sharp increase of active GSK-3β-IF signal in DAT-IF neurons within the SNpc already 6 h after the 2nd MPTP injection, thereby preceding SNpc degeneration.
Fig. 5
Fig. 5
Wnt1 expression in MPTP-injured VM and VM astrocytes. (A) Western blot analysis of Wnt1 protein in saline (-MPTP) and at different time intervals after MPTP (n=4/time point). Embryonic (E-14) brain was used as a control tissue. Data from the experimental bands were normalized to beta-actin, as above, values expressed as percent (%) of saline-injected controls. *p<0.05 vs. -MPTP. (B–C) Wnt1 mRNA transcription in astrocytes derived ex vivo from MPTP-injured VM (3 dpt). Total RNA was extracted and processed as described, and 250 ng of cDNA was used for semi-quantitative polymerase chain reaction (RT-qPCR) using specific primer pairs for Wnt1 (F: ccgagaaacagcgttcatct; R: gcctcgttgttgtgaaggtt; amplicon: 252 bp) and β-actin (F: cttttccagccttccttctt; R: tcaggaggagcaatgatctt; amplicon: 220 bp). Embryonic (E-14) brain was used as a control tissue. Samples from PCR reactions were separated electrophoretically on 2% agarose gel containing 0.2 μg/ml of ethidium bromide. Fluorescent bands of amplified gene products were captured by using Gel Logic 200 Imaging System (Kodak). Note the sharp increase in Wnt1 mRNA transcription (B, C) in samples derived from VM astrocytes of MPTP mice as opposed to controls (-MPTP). (D–E) In situ hybridization with Wnt1 probe was carried out in midbrain sections (at the level of the SNpc) overnight as described, using FITC antisense RNA probe (Sigma Aldrich) specific for Wnt1. GFAP-Ab was then applied for dual localization, in saline (-MPTP) and 2 dpt (n=4/group). Wnt1 signal (green) was not revealed in uninjured VM or GFAP+ astrocytes (red, D), whereas after MPTP (E) Wnt1 mRNA signal (green) and GFAP+ astrocyte signal (red), colocalized (orange–yellow).
Fig. 6
Fig. 6
Astrocytes and Wnt1/β-catenin signaling rescue mesencephalic DAergic neurons from MPP+-induced TH+ neurotoxicity. Enriched mesencephalic neuronal cultures at 7 DIV, prepared as described, received increasing doses of MPP+ and the number of TH+ neurons (A) and [3H]DA incorporation (B) analyzed after 24 h, the data expressed as percent (%) of control values (see Materials and methods). Wnt1 (100 ng/ml, A–B, F) or the Wnt antagonist, Dkk1 (100 ng/ml), were applied either alone or in combination. In this case, application of Dkk1 preceded Wnt1 administration. (G–L) Differences were analyzed by ANOVA followed by Newman–Keuls test and considered significant when p<0.05. °p<0.05 vs. -MPP+ within each respective group; *p<0.05 vs. PBS, within each respective group; #p<0.01 vs. Wnt1, within each respective group. (C–E) Representative immunocytochemical images showing purified mesencephalic TH+ neurons (red) in control (Ct) conditions (-Mpp+, C) and 24 h after MPP+ at 5 μM (D) or 50 μM (E). Nuclei were counterstained with DAPI (blue). Note the marked neuroprotection afforded by Wnt1 treatment at both doses (F–G). (H–I) Astrocyte–neuron cultures at 7–9 DIV received increasing doses of MPP+ and DAergic toxicity analyzed as above both in the absence or the presence of a concomitant treatment with the specific GSK-3β antagonist AR (5 μM, Osakada et al., 2007). For Wnt antagonism, Dkk1 (100 ng/ml) was applied prior MPP+ application. (L–Q) Representative immunocytochemical images showing astrocyte–neuron cultures at 7–9 DIV. (L) Control culture stained for TH+ (red) and counterstained with DAPI (blue). Differences were analyzed by ANOVA followed by Newman–Keuls test. °p<0.05 vs. PBS, within each respective group; (M–Q) representative confocal images of dual staining with TH+ (green) and GFAP (red) of astrocyte–neuron cultures without (M) and 24 h after 5 (N) or 50 μM (O) of MPP+. Note the increased branching and varicosities of control TH+ neurons in the presence of astrocytes (M–N), and the significant protection afforded by astrocytes at 5 μM (N) and 25 μM (H–I) MPP+ doses. In addition, exogenous activation of Wnt signaling with the GSK-3 inhibitor sharply magnified astrocyte neuroprotective effect (P–Q). Note the increased process length and branching of TH+ neurons even at the highest (50 μM) MPP+ dose (Q). (R–T) Purified mesencephalic neurons were exposed to astrocyte inserts (i.e., indirect co-culture paradigm) and increasing doses of MPP+ were applied, both in the absence and the presence of a blocking antibody against Wnt1 (Wnt1-Ab, 2 μg/ml) or the Wnt/Fzd antagonist, Fzd-A (200 ng/ml). Differences were analyzed by ANOVA followed by Newman–Keuls test. °p<0.05 vs. PBS, within each respective group. Note the ability of astrocyte inserts to increase by twofold TH+ neuron survival (R, S) as opposed to purified neurons alone (A, D, E), whereas this effect is counteracted by Wnt1 blocking antibody (T), or Fzd-A.
Fig. 7
Fig. 7
Chemokine-activated astrocytes express Wnt1 and promote dopaminergic neurogenesis from adult midbrain neural stem/precursor cells (NPCs) via Wnt/β-catenin activation. (A) Expression levels of Wnt1 mRNA in untreated (UAstro) or treated (TAstro) ventral midbrain (VM) astrocyte cultures. VM astrocytes grown as described received a pretreatment with PBS (UAstro) or increasing doses (50–1000 ng/ml) of one the chemokines (CCL3, CXCL10 or CXCL11, TAstro). Treatments were carried out only one time and cells processed 24 hpt for real time PCR. (B–C) In situ hybridization with Wnt1 probe was carried in U/TAstro, as described, using FITC antisense RNA probe specific for Wnt1. GFAP-Ab was then applied for dual localization, in control (pbs) UAstro (B) and 24 h after CXCL10 treatment (C). In control cultures, only a slight Wnt1 signal (green) was revealed in GFAP+ astrocytes (red), whereas after CXCL10 (D), a robust Wnt1 mRNA signal (green) colocalized with GFAP+ astrocyte signal (red). (D) Morphology and marker expression of aNPCs derived from midbrain/hindbrain (MB) during in vitro expansion. Spheres were cultured for 2–3 h to allow attachment and then stained with nestin (panel Da, b) and BrdU (c).The spheres were cultured in the presence of 5 μM BrdU for 24 h before plating. Nuclei were counterstained with DAPI. The respective marker protein is expressed in nearly all cells within the neurosphere and after withdrawal of mitogens (d). (E) Effect of co-culture of U/TAstro with aNPCs derived from MB (E, and J–L) or SVZ (F–I). Tuj1+ cells was determined relative to the total number of DAPI+ nuclei (E, %Tuj1+/DAPI+); the number of BrdU+ cells was determined relative to the total number of Tuj1+ cells (E, %BrdU+/Tuj1). Within 24 h of BrdU pulse, approximately 25% of the Tuj1+ cells were labeled, an effect counteracted by Dkk1 treatment. Direct application of recombinant Wnt1 protein (100 ng/ml), significantly increased the number of Tuj1+ cells (see M, N, O), and the proportion of BrdU+ out of the total number of Tuj1+ cells in aNPC derived from MB (O) and SVZ (I). (P) VM astrocytes promote DA neurogenesis in MB aNPCs. After 7 DIV, TAstro produced 3–4 times more TH+ cells out of the total number of Tuj1+, as compared to UAstro (<3%). (Q–S) Confocal images of a Tuj1+ TH+ neuron extending long TH+ processes with numerous varicosities. Differences between means were analyzed by ANOVA and considered significant when p<0.05. *p<0.05 vs. NPCs alone; **p<0.05 vs. UAstro; °p<0.05 vs. U/TAstro, within each respective group.
Fig. 8
Fig. 8
Dysregulation of Wnt1/β-catenin signaling and lack of nigrostriatal recovery of middle-aged mice are reversed by exogenous activation of Wnt/β-catenin signaling. (A–B) Representative confocal images of midbrain sections at the level of the SNpc in middle-aged (9–11 months of age) mice showing dual labeling with TH and GFAP-Ab 42 days after saline (A) or MPTP (B) administration. (C) In situ hybridization with FITC antisense RNA probe for Wnt1 (carried out as described in the legend for Fig. 5) and immunolocalization of GFAP in midbrain sections of middle-aged mice 2 days after MPTP (n=3/group). Note the lack of Wnt1 expression after MPTP in aging mice. (D–F) Real-time PCR for Wnt1 (D), Fzd-1 (E), and β-catenin (F) mRNA transcripts in VM samples of saline and MPTP mice in the absence or the presence of a systemic treatment with saline or the specific GSK-3β inhibitor (AR, 10 mg/kg twice a day) starting 3 days after MPTP (arrow). Transcript levels were measured at different time intervals after MPTP/saline and MPTP/AR (n=4/time point), as described. (G) Active GSK-3β (GSK-3β phospho-Tyr216) protein levels as determined by wb (n=4/time point). Data from the experimental bands were normalized to beta-actin, as above, values expressed as percent (%) of saline-injected controls. *p<0.05 vs. -MPTP; °p<0.05 vs. -AR. (H) Loss of TH+ neurons within the SNpc at different time intervals in MPTP/saline and MPTP/AR (n=6/time point). *p<0.05 vs. -MPTP; °p<0.05 vs. -AR. (I–J) Representative confocal images showing dual localization of TH+ neurons (green) and GFAP+ astrocytes (red) in saline/AR (I) and MPTP/AR 42 days post-MPTP (J). (K) HPLC analysis of dopamine in the striatum (Str) of saline and MPTP mice (n=6/time point). Differences were analyzed by ANOVA followed by Newman–Keuls test, and considered significant when p<0.05. *vs. saline; °p<0.05 vs. MPTP-AR. (L) DAT-IR in striatum (Str) assessed by immunofluorescent staining as indicated in legend for Fig. 1 (n=6/time point). Fluorescence intensity values (FI, means ± SEM) are expressed as percent (%) of saline. *p<0.05 vs. ct, °p<0.05 vs. -AR. (M–P) Representative confocal images showing DAT-IF (revealed by FITC, green) in Str of saline (M), saline/AR (N), MPTP/saline (O), and MPTP/AR (P).
Fig. 9
Fig. 9
MPTP-reactive astrocytes and Wnt/β-catenin signaling link nigrostriatal injury to repair. A simplified scheme illustrating MPTP-dependent neuroinflammation and astrocyte activation of Wnt1/Fzd-1/β-catenin neurorescue signaling cascade directing towards DAergic neuron survival and/or promoting DAergic neurogenesis in the adult injured midbrain. Dysregulation of astrocyte-dependent Wnt1/Fzd signaling as a result of GSK-3β activation, Wnt antagonism or aging, may limit DAergic survival/recovery upon MPTP/MPP+ and/or direct towards DAergic degeneration, while exogenous activation of Wnt/β-catenin signaling promote neurorescue.

Similar articles

Cited by

References

    1. Abercrombie M. Estimation of nuclear population from microtome sections. Anat. Rec. 1946;94:239–247. - PubMed
    1. Aberle H, Bauer A, Stappert J, Kispert A, Kemler R. Beta-catenin is a target for the ubiquitin–proteasome pathway. EMBO J. 1997;16(13):3797–3804. - PMC - PubMed
    1. Abou-Sleiman PM, Muqit MM, Wood NW. Expanding insights of mitochondrial dysfunction in Parkinson’s disease. Nat. Rev. Neurosci. 2006;7:207–219. - PubMed
    1. Adachi K, Mirzadeh Z, Sakaguchi M, Yamashita T, Nikolcheva T, Gotoh Y, et al. β-Catenin signaling promotes proliferation of progenitor cells in the adult mouse subventricular zone. Stem Cells. 2007;25:2827–2836. - PubMed
    1. Alvarez-Builla A, Garcia-Verdugo JM, Tramontin AD. A unified hypothesis on the lineage of neural stem cells. Nat. Rev. Neurosci. 2001;2(4):2287–2293. - PubMed

Publication types

MeSH terms