Comparative Study
. 2010 Dec;87(12):E985-1002.
doi: 10.1097/OPX.0b013e3181fef1aa.

Vision therapy in adults with convergence insufficiency: clinical and functional magnetic resonance imaging measures

Affiliations
Comparative Study

Vision therapy in adults with convergence insufficiency: clinical and functional magnetic resonance imaging measures

Tara L Alvarez et al. Optom Vis Sci. 2010 Dec.

Abstract

Purpose: This research quantified clinical measurements and functional neural changes associated with vision therapy in subjects with convergence insufficiency (CI).

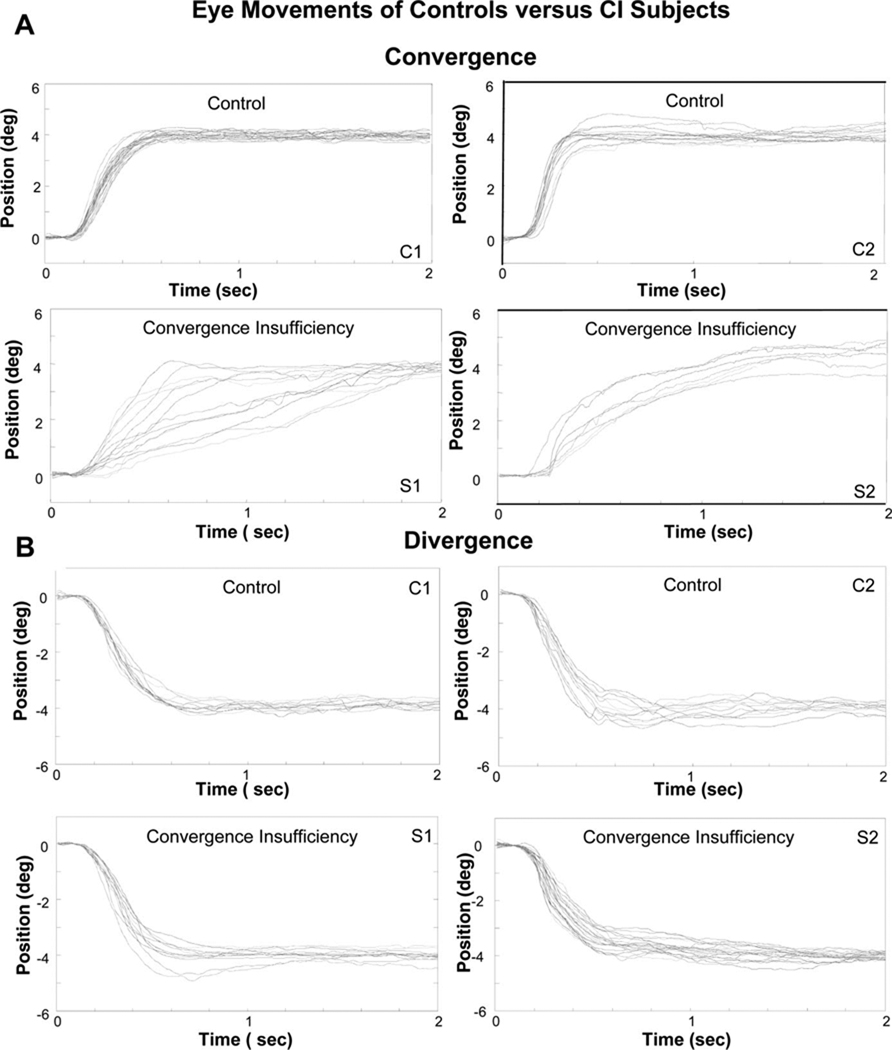
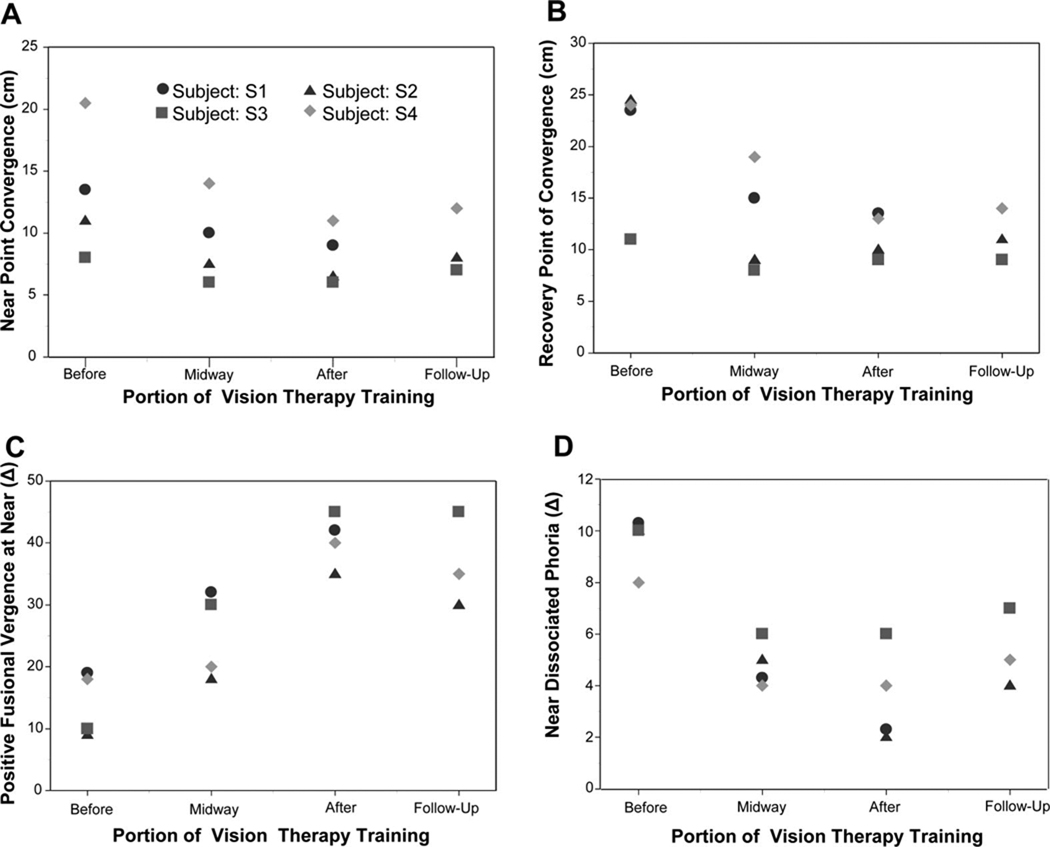
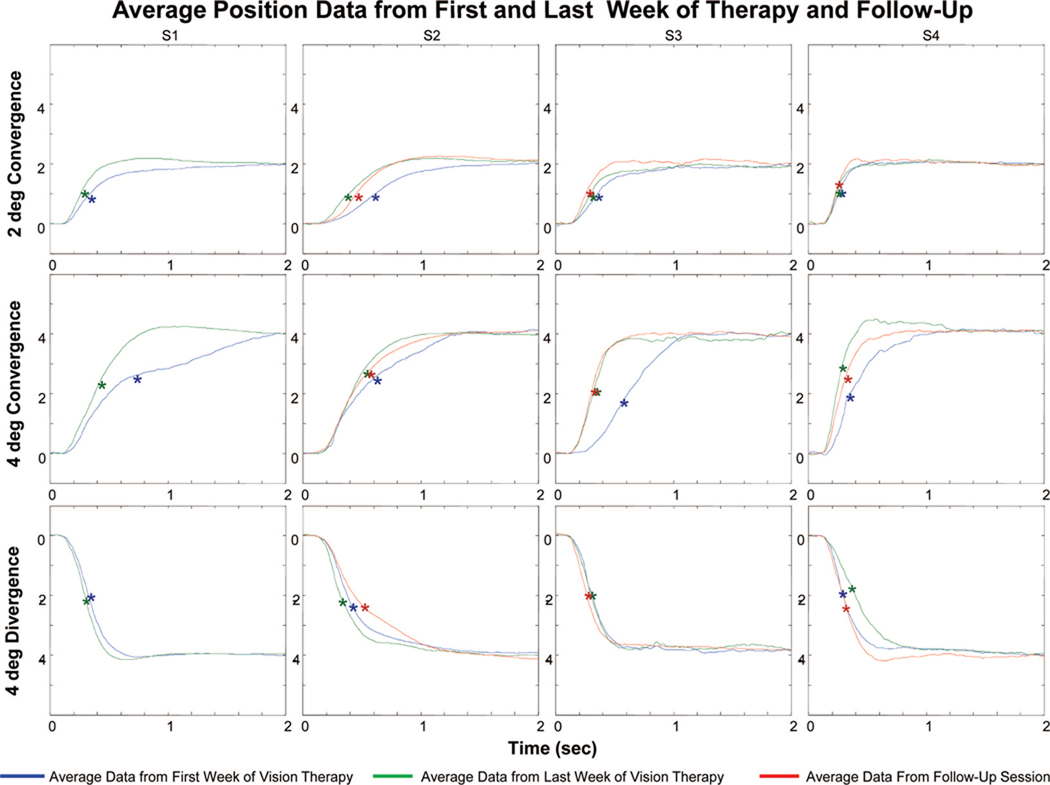
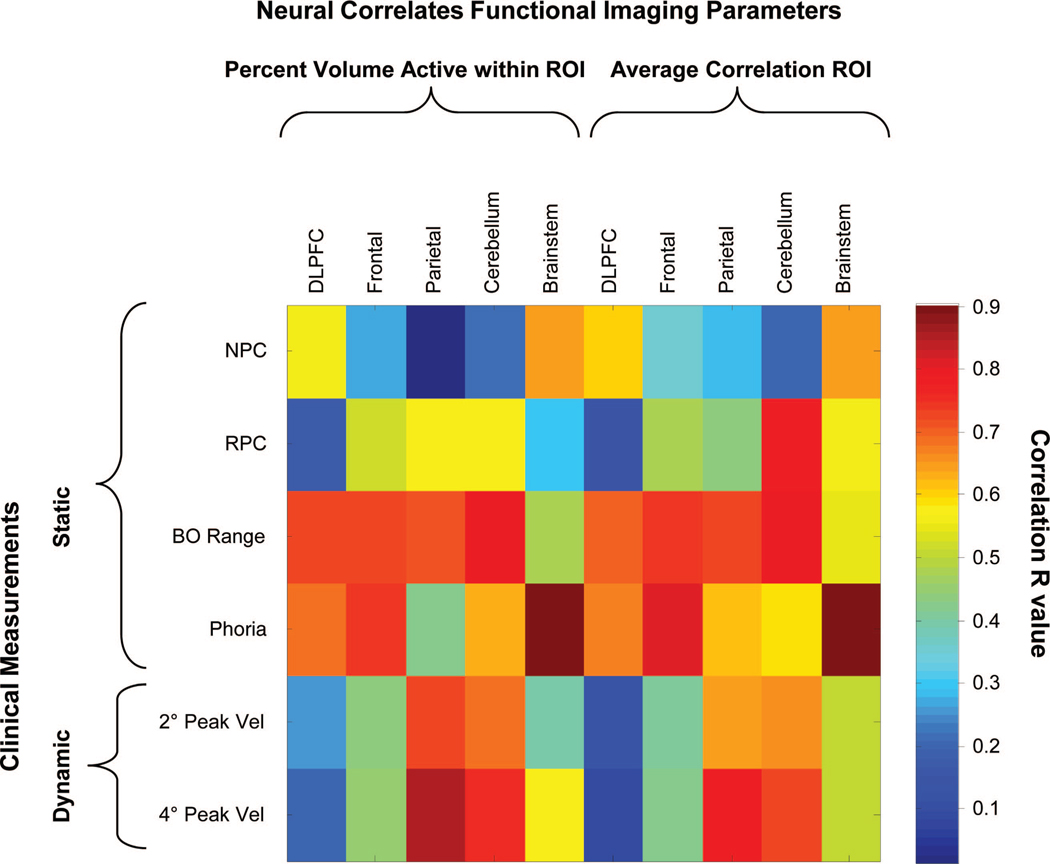
Methods: Convergence and divergence 4° step responses were compared between 13 control adult subjects with normal binocular vision and four CI adult subjects. All CI subjects participated in 18 h of vision therapy. Clinical parameters quantified throughout the therapy included: nearpoint of convergence, recovery point of convergence, positive fusional vergence at near, near dissociated phoria, and eye movements that were quantified using peak velocity. Neural correlates of the CI subjects were quantified with functional magnetic resonance imaging scans comparing random vs. predictable vergence movements using a block design before and after vision therapy. Images were quantified by measuring the spatial extent of activation and the average correlation within five regions of interests (ROI). The ROIs were the dorsolateral prefrontal cortex, a portion of the frontal lobe, part of the parietal lobe, the cerebellum, and the brain stem. All measurements were repeated 4 months to 1 year post-therapy in three of the CI subjects.

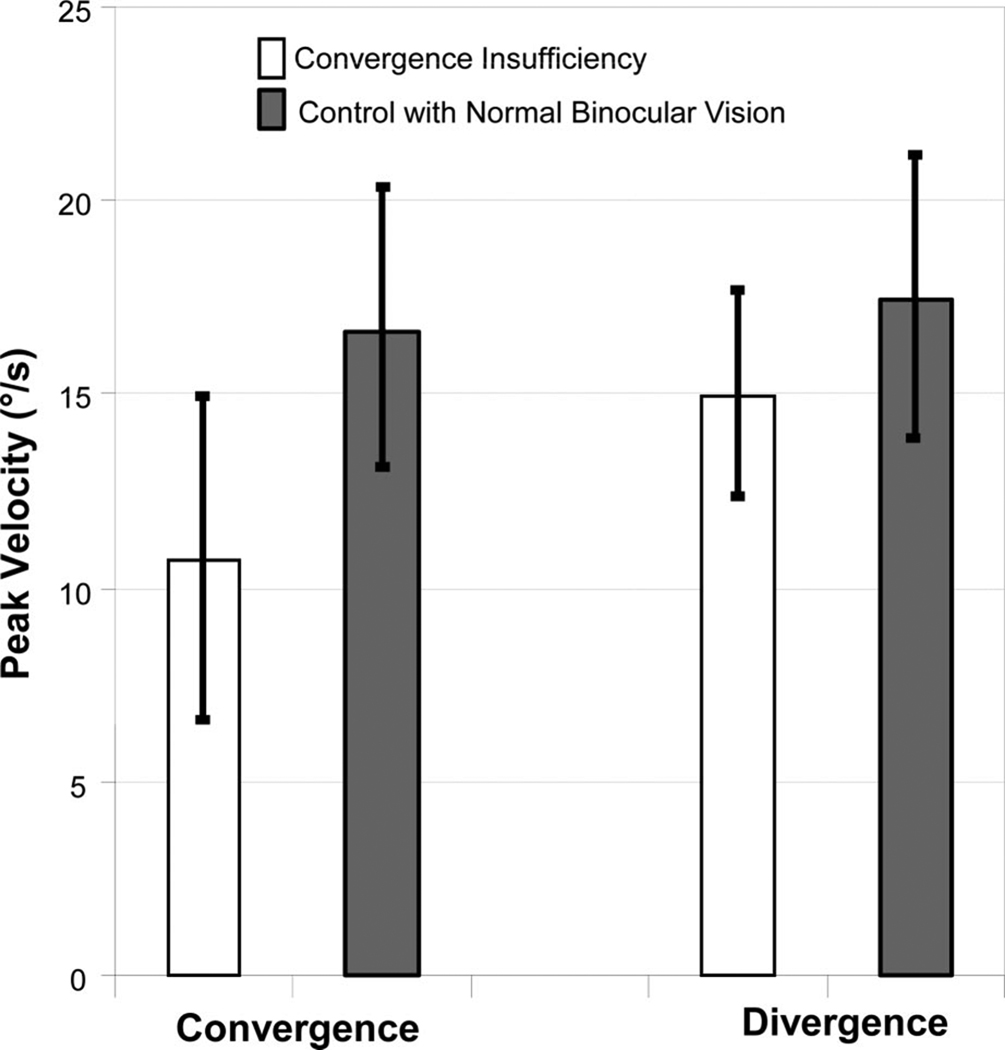
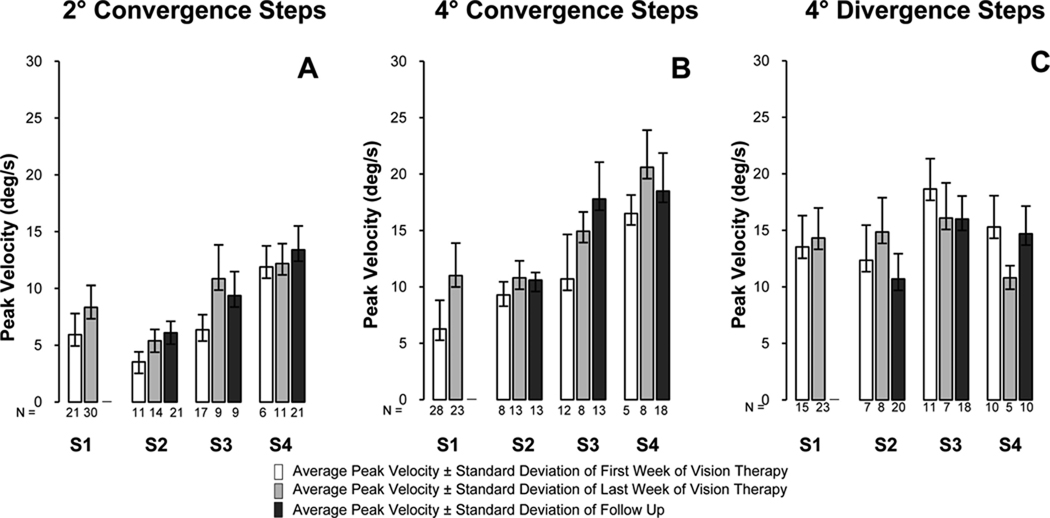
Results: Convergence average peak velocities to step stimuli were significantly slower (p = 0.016) in CI subjects compared with controls; however, significant differences in average peak velocities were not observed for divergence step responses (p = 0.30). The investigation of CI subjects participating in vision therapy showed that the nearpoint of convergence, recovery point of convergence, and near dissociated phoria significantly decreased. Furthermore, the positive fusional vergence, average peak velocity from 4° convergence steps, and the amount of functional activity within the frontal areas, cerebellum, and brain stem significantly increased. Several clinical and cortical parameters were significantly correlated.

Conclusions: Convergence peak velocity was significantly slower in CI subjects compared with controls, which may result in asthenopic complaints reported by the CI subjects. Vision therapy was associated with and may have evoked clinical and cortical activity changes.


Conflict of interest statement

None of the authors within this manuscript have commercial associations with the research that could result in a conflict of interest.

Figures

FIGURE 1
FIGURE 1
(A) Schematic of custom fMRI compatible LED visual stimulator, which was symmetrically aligned along the subject’s midline. The subject viewed the target using a mirror. (B) Experimental design showing the pattern of illumination for the three visual targets for the 40 s duration for a given page during the random phase followed by 40 s of a predictable vergence task using a standard block design. Vergence stimulus position is the combined stimulation to both eyes where vergence is denoted as the difference between the left eye and the right eye stimulus. Convergence is plotted as positive, and divergence is plotted as negative. A color version of this figure is available online at www.optvissci.com.
FIGURE 2
FIGURE 2
(A) Position responses (°) as a function of time (sec) from 4° convergence symmetrical steps with similar initial positions from two control subjects with normal binocular vision and from two CI subjects. The CI subjects have slower transient movements compared with the controls. (B) Position responses (°) as a function of time (s) from 4° divergence symmetrical steps with similar initial positions. The upper traces are from control subjects, and the lower traces are from CI subjects. Divergence eye movements are similar between the two cohorts of subjects. A color version of this figure is available online at www.optvissci.com.
FIGURE 3
FIGURE 3
Average peak velocities ± one standard deviation from 4° convergence steps (left) and 4° divergence steps (right) from subjects with CI (white) and controls with normal binocular vision (gray). Convergence is significantly slower in the four CI subjects compared with the 13 controls. Conversely, no significant difference is observed with divergence.
FIGURE 4
FIGURE 4
Clinical measurements included the NPC (plot A), RPC (plot B), PFV at near using a BO prism bar (plot C), and near dissociated phoria (plot D), which were measured before, midway, after therapy, and during a follow-up visit. All subjects were exophoric. S1 was unable to return for the follow-up visit. These measurements are the absolute values and not the change in parameters. The change in parameters is found in Table 1. A color version of this figure is available online at www.optvissci.com.
FIGURE 5
FIGURE 5
Plots of the average vergence position vs. time trace from the first week (blue), last week (green), and during a follow-up session (red). Convergence movements from 2° (top row) and 4° (middle row) step stimuli show that CI subjects can fixate on the new target faster after than before vision therapy. Average divergence 4° (bottom row) responses are shown for each session, and consistent changes are not observed. The asterisks denote the peak velocity for each trace.
FIGURE 6
FIGURE 6
Average peak velocity ± one standard deviation for subjects S1 through S4 for 2° convergence (plot A), 4° convergence (plot B), and 4° divergence (plot C) responses from the first week of training (one bar), last week of training (light gray bar), and during a follow-up session (dark gray bar). The number of responses analyzed is denoted under each bar.
FIGURE 7
FIGURE 7
Axial and sagittal view of data from functional imaging experiment studying prediction for four CI subjects. Images on the left column are the average of the before vision therapy data set, the middle column are after vision therapy, and the right column are from a follow-up scan. On average, increases in spatial extent (amount of significant activation) and/or intensity are observed when comparing the before and after scans.
FIGURE 8
FIGURE 8
Longitudinal fMRI analysis of CI subjects S1 through S4. (A) Quantification of the percentage of voxels within an ROI showed that they were statistically significant during the fMRI experiment. Results show an increase in spatial extent when comparing data from before vision therapy (blue) with after vision therapy (green) and during the follow-up visit (red). For the five ROIs studied noted in the header of each plot, the spatial extent increased after training for all four CI subjects. (B) Average correlation of each ROI during the fMRI experiment showing an increase in correlation within an ROI from before vision therapy (blue) to after vision therapy (green) and during the follow-up visit (red). IPA, inferior parietal area; BA, Brodmann area. A color version of this figure is available online at www.optvissci.com.
FIGURE 9
FIGURE 9
Linear regression analysis of clinical parameters vs. the functional imaging parameters (percent activation within an ROI and average correlation within an ROI). Clinical parameters include NPC, RPC, BO positive vergence range (BO range), near dissociated phoria, average 2° peak velocity (2° PeakVel), and average 4° peak velocity (4° PeakVel). Imaging parameters are the percent volume active within an ROI and average correlation for five ROIs studied. The correlation value is denoted in the scale bar. Parameters that are strongly correlated are plotted in red whereas parameters that are weakly correlated are plotted in blue.

References

    1. Rouse MW, Hyman L, Hussein M, Solan H. Frequency of convergence insufficiency in optometry clinic settings. Convergence Insufficiency and Reading Study (CIRS) Group. Optom Vis Sci. 1998;75:88–96. - PubMed
    1. Scheiman M, Gallaway M, Coulter R, Reinstein F, Ciner E, Herzberg C, Parisi M. Prevalence of vision and ocular disease conditions in a clinical pediatric population. J Am Optom Assoc. 1996;67:193–202. - PubMed
    1. Rouse MW, Borsting E, Hyman L, Hussein M, Cotter SA, Flynn M, Scheiman M, Gallaway M, De Land PN. Frequency of convergence insufficiency among fifth and sixth graders. The Convergence Insufficiency and Reading Study (CIRS) group. Optom Vis Sci. 1999;76:643–649. - PubMed
    1. Hokoda SC. General binocular dysfunctions in an urban optometry clinic. J Am Optom Assoc. 1985;56:560–562. - PubMed
    1. Porcar E, Martinez-Palomera A. Prevalence of general binocular dysfunctions in a population of university students. Optom Vis Sci. 1997;74:111–113. - PubMed

Publication types

MeSH terms