. 2010 Dec 1;29(23):3979-91.
doi: 10.1038/emboj.2010.272. Epub 2010 Nov 5.

The structure of an Iws1/Spt6 complex reveals an interaction domain conserved in TFIIS, Elongin A and Med26

Affiliations

The structure of an Iws1/Spt6 complex reveals an interaction domain conserved in TFIIS, Elongin A and Med26

Marie-Laure Diebold et al. EMBO J. .

Abstract

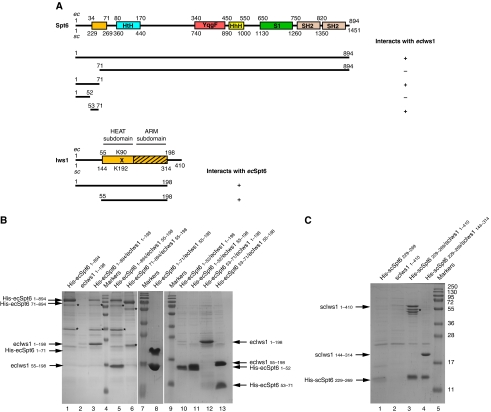
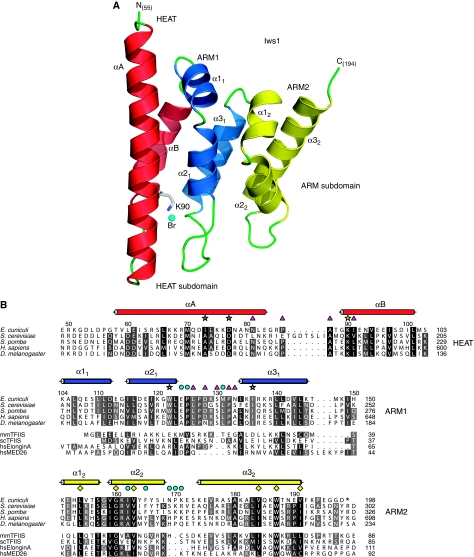
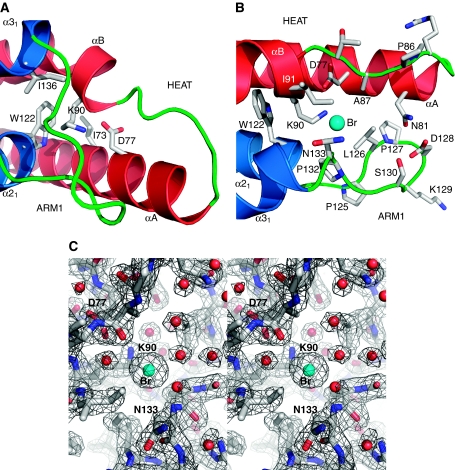
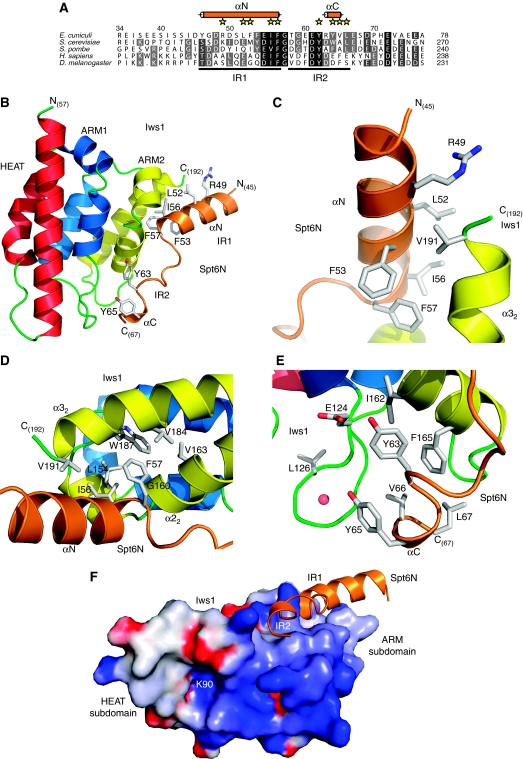
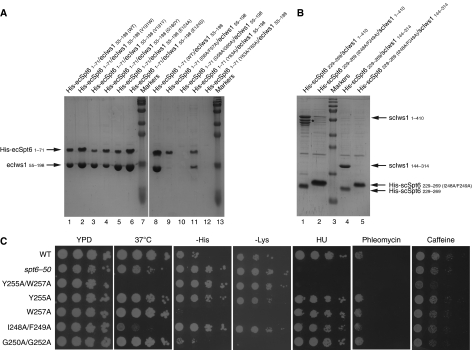
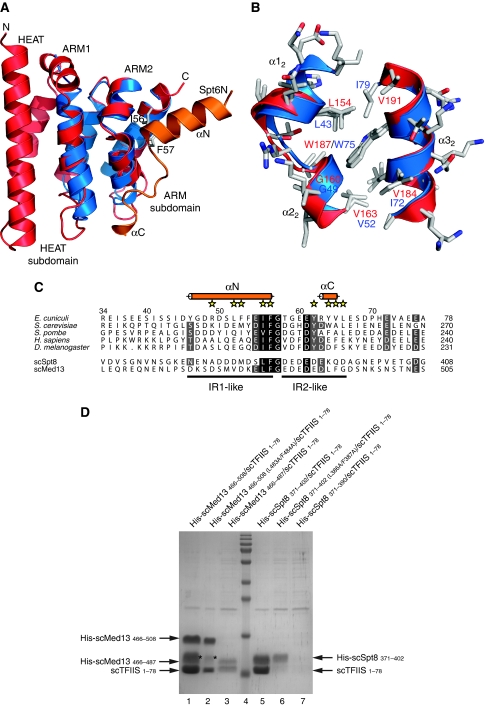
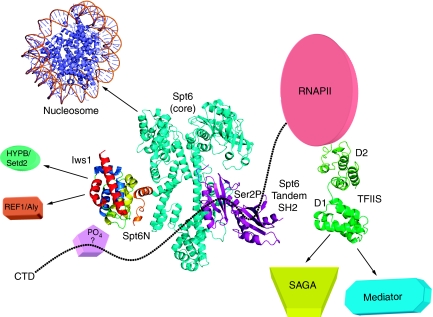
Binding of elongation factor Spt6 to Iws1 provides an effective means for coupling eukaryotic mRNA synthesis, chromatin remodelling and mRNA export. We show that an N-terminal region of Spt6 (Spt6N) is responsible for interaction with Iws1. The crystallographic structures of Encephalitozoon cuniculi Iws1 and the Iws1/Spt6N complex reveal two conserved binding subdomains in Iws1. The first subdomain (one HEAT repeat; HEAT subdomain) is a putative phosphoprotein-binding site most likely involved in an Spt6-independent function of Iws1. The second subdomain (two ARM repeats; ARM subdomain) specifically recognizes a bipartite N-terminal region of Spt6. Mutations that alter this region of Spt6 cause severe phenotypes in vivo. Importantly, the ARM subdomain of Iws1 is conserved in several transcription factors, including TFIIS, Elongin A and Med26. We show that the homologous region in yeast TFIIS enables this factor to interact with SAGA and the Mediator subunits Spt8 and Med13, suggesting the molecular basis for TFIIS recruitment at promoters. Taken together, our results provide new structural information about the Iws1/Spt6 complex and reveal a novel interaction domain used for the formation of transcription networks.


Conflict of interest statement

The authors declare that they have no conflict of interest.

Figures

Figure 1
Figure 1
A small N-terminal region of Spt6 is sufficient to retain the full length or the conserved domain of Iws1. (A) Schematic view of the putative domain architecture of Spt6 and Iws1. The domains of Spt6 and Iws1 characterized in this study are shown as light orange boxes. This domain in Iws1 is composed of two subdomains (HEAT subdomain and ARM subdomain) and corresponds to the conserved region of Iws1 sufficient for Iws1 function in yeast (Fischbeck et al, 2002). The Iws1 invariant lysine (scK192/ecK90) involved in the Spt6-independent function of Iws1 is marked by an ‘X'. The Iws1 region homologous to TFIIS, Elongin A and Med26 N-terminal domains is hatched. The domains (HtH, YqgF, HhH and S1) that have been putatively assigned to the Spt6 core domain based on the structure of the bacterial Tex protein (Johnson et al, 2008) are shown. The two SH2 domains from the tandem SH2 domains at the C-terminus of Spt6 (Diebold et al, 2010; Sun et al, 2010) are indicated. The results of co-expression experiments shown in (B) are summarized below the proteins. E. cuniculi (ec) and S. cerevisiae (sc) numbering are shown. (B) Deciphering of E. cuniculi Iws1/Spt6 complex formation upon (co-) expression in E. coli of various constructs of both proteins and purification by affinity chromatography. All samples are analysed on SDS–PAGE. The fainter band for His-ecSpt6N53−71 in lane 12 compared with lane 13 is due to the lower amount of soluble complex obtained. Construct boundaries are indicated. Spt6 degradation products are marked with an ‘*'. (C) Characterization of the S. cerevisiae Iws1/Spt6N interaction based on the data obtained with the E. cuniculi proteins. The faint band for His-scSpt6N229−269 in lane 1 is most likely due to the poor solubility of this construct when expressed alone. Iws1 degradation products are marked with an ‘*'. Molecular weights are shown and are the same throughout the figures.
Figure 2
Figure 2
Structure of E. cuniculi Iws1. (A) Ribbon representation of ecIws155−198 crystal structure. α-helices of the HEAT, ARM1 and ARM2 motifs are coloured red, blue and yellow, respectively. Loops are coloured green. The two subdomains of Iws1 are indicated. The invariant K90 is displayed as sticks and coloured according to atom type. The anion bound to K90 Nɛ is shown as a cyan sphere. The first and last residues observed in the density are labelled. This colour scheme is used throughout the figures unless otherwise stated. The ribbon figures have been made with PYMOL (version 0.99; DeLano Scientific). (B) Multiple sequence alignment of the conserved region of Iws1 (top five rows) with the TFIIS, Elongin A and Med26 N-terminal domains (bottom three rows; not shown for the HEAT repeat, which is Iws1 specific). mm, Mus musculus; sc, S. cerevisiae; hs, H. sapiens. Sequence similarities are indicated by shading. Observed α-helices in the ecIws155−198 structure are shown above the sequences as cylinders coloured as in (A). Numbering above the sequences correspond to E. cuniculi, whereas the numbering at the end of each row relates to the different organisms. K90 and the residues involved in its packing at the interface of the HEAT and ARM1 repeats are labelled with yellow stars. Residues forming the highly conserved putative phosphate-binding domain of Iws1, together with K90, are labelled by magenta triangles. Residues involved in Spt6 IR1 and IR2 binding are labelled with yellow diamonds and cyan circles, respectively. Alignment features are identical in all figures unless otherwise stated. Alignments were created with ALINE (Bond and Schuttelkopf, 2009).
Figure 3
Figure 3
The HEAT-subdomain Iws1. (A) Close-up view of K90 interactions at the interface of Iws1 HEAT and ARM1 repeats. The side chains involved in hydrophobic interactions and hydrogen bonding are shown. (B) Close-up view of the HEAT subdomain formed by Iws1 HEAT and ARM1 repeats. Residues forming the surface are displayed. The bromide anion (Br) is shown as a cyan sphere. (C) Stereo view of the structure at the bromide-binding site. The bromide (Br) and water molecules are shown as cyan and red spheres, respectively. The 2Fo–Fc electron density map of the refined structure is shown and contoured at 1.5 σ.
Figure 4
Figure 4
Crystal structure of E. cuniculi Iws1/Spt6N complex. (A) Multiple sequence alignment of the Iws1-binding region of Spt6N. Both Spt6N IR1 and IR2 sub-regions are indicated below the sequences. Residues whose side chains are involved in Iws1 binding are labelled with yellow stars. Spt6N α-helices observed in the Iws1/Spt6N structures are shown as orange cylinders. (B) Ribbon representation of the Spt6N34−71/Iws155−198 structure. Spt6N is coloured orange. Most Spt6N side chains interacting with Iws1 are shown. (C) Close-up view of the interaction between Spt6N αN and Iws1 α32 helices. (D) Close-up view of Spt6N IF motif binding to Iws1 hydrophobic cavity. (E) Close-up view of Spt6N IR2 binding to Iws1. The red sphere represents a water molecule. (F) GRASP (Nicholls et al, 1991) representation of the electrostatic potential at the surface of E. cuniculi Iws1. The electrostatic potentials −8 and +8 kBT (kB, Boltzmann constant; T, temperature) are coloured red and blue, respectively. The Spt6N region binding to Iws1 is shown as orange ribbon. K90 Nɛ is located within a cavity and is labelled (K90).
Figure 5
Figure 5
Mutational and in vivo analysis of the Iws1/Spt6 complex. (A) Analysis of the E. cuniculi Iws1/Spt6N complex by mutation of Iws1- and Spt6N-specific residues involved in complex formation. Stronger effects are observed by mutating the Spt6N protein. (B) Analysis of the full-length S. cerevisiae Iws1/Spt6 complex by mutation of the IF motif, confirming the result observed for the E. cuniculi Iws1/Spt6N complex. The mutant migrates more slowly than the wild-type construct. Degradation products are marked by an *. (C) Analysis of Spt6 mutants within the Iws1-binding region of full-length S. cerevisiae Spt6. Strains were grown to saturation in YPD, serially diluted 10-fold and spotted on the indicated media. Included for comparison was spt6-50, a previously characterized mutant.
Figure 6
Figure 6
Specific interaction of TFIIS N-terminal domain with Spt8 and Med13. (A) Superposition of E. cuniculi Iws1 (red) and mouse TFIIS Domain I (blue) structures. For comparison, the position of Spt6N (orange) bound to Iws1 is shown. (B) Superposition of the hydrophobic (IF-binding) pockets of E. cuniculi Iws1 (red) and mouse TFIIS domain I (blue). All side chains are shown. (C) Multiple sequence alignment of the Iws1-binding region of Spt6N (top five rows) and of the putative TFIIS-binding region of S. cerevisiae (sc) Spt8 and Med13 (bottom two rows). (D) Reconstitution by co-expression of the complexes formed between S. cerevisiae TFIIS (1–78) and Med13 (466–508), and S. cerevisiae TFIIS (1–78) and Spt8 (371–402). Importance of the IF motifs and acidic regions on complex formation is addressed by using specific mutants. Degradation products of Med13 are labelled with an ‘*'.
Figure 7
Figure 7
Model of the transcription networks made by Iws1/Spt6 and TFIIS. Based on the results presented in this article as well as previously published data, the figure provides a current model of the Iws1/Spt6 complex and recapitulates our current knowledge of the transcription networks affected by Iws1/Spt6 and TFIIS, including homologous domains (ARM subdomain for Iws1 and Domain I for TFIIS). The model for Spt6 has been assembled from (i) the structure of the bacterial Tex protein that shares sequence homology with the core domain of Spt6 (cyan; Johnson et al, 2008), (ii) the recently discovered C-terminal tandem SH2 domains of Spt6 (purple; Diebold et al, 2010; Sun et al, 2010) and (iii) the Iws1/Spt6N complex (coloured as in previous figures; this manuscript). The N-terminal acidic domain of Spt6 is not included. Interactions of Iws1/Spt6 and TFIIS with different transcriptional effectors are shown with arrows. The C-terminal domain of the RNA polymerase II (CTD) is shown as dotted line. Binding of the Spt6 tandem SH2 repeats to Ser2-phosphorylated CTD repeats has been labelled with ‘Ser2P'. The putative CTD binding to the HEAT subdomain of Iws1, possibly through a phosphorylated residue and the requirement of an unknown factor, has been labelled with ‘?'. The PDB codes for the structures used to make the figure are 1AOI, 1WJT, 2XP1, 3BZC, 3GTM and 3GXW.

Similar articles

Cited by

References

    1. Adkins MW, Tyler JK (2006) Transcriptional activators are dispensable for transcription in the absence of Spt6-mediated chromatin reassembly of promoter regions. Mol Cell 21: 405–416 - PubMed
    1. Andrade MA, Petosa C, O'Donoghue SI, Muller CW, Bork P (2001) Comparison of ARM and HEAT protein repeats. J Mol Biol 309: 1–18 - PubMed
    1. Ardehali MB, Yao J, Adelman K, Fuda NJ, Petesch SJ, Webb WW, Lis JT (2009) Spt6 enhances the elongation rate of RNA polymerase II in vivo. EMBO J 28: 1067–1077 - PMC - PubMed
    1. Boeke JD, LaCroute F, Fink GR (1984) A positive selection for mutants lacking orotidine-5′-phosphate decarboxylase activity in yeast: 5-fluoro-orotic acid resistance. Mol Gen Genet 197: 345–346 - PubMed
    1. Bond CS, Schuttelkopf AW (2009) ALINE: a WYSIWYG protein-sequence alignment editor for publication-quality alignments. Acta Crystallogr D Biol Crystallogr 65(Part 5): 510–512 - PubMed

Publication types

MeSH terms