. 2010 Dec;7(12):1009-15.
doi: 10.1038/nmeth.1528. Epub 2010 Nov 7.

Analysis and design of RNA sequencing experiments for identifying isoform regulation

Affiliations

Analysis and design of RNA sequencing experiments for identifying isoform regulation

Yarden Katz et al. Nat Methods. 2010 Dec.

Abstract

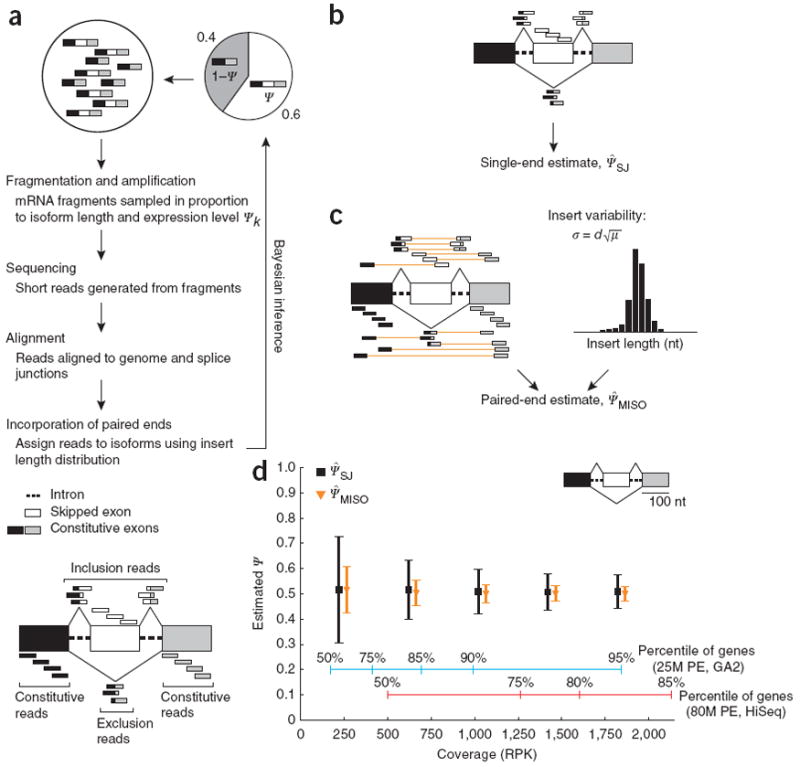
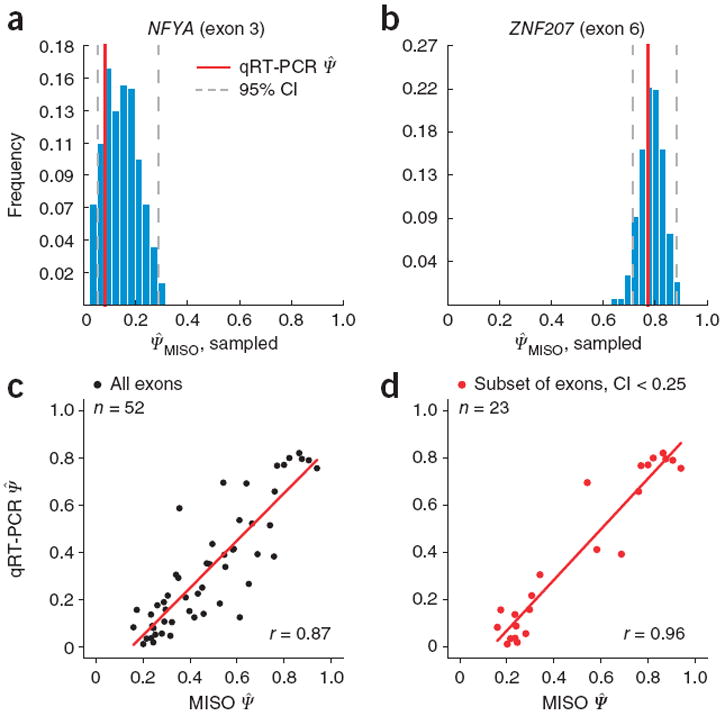
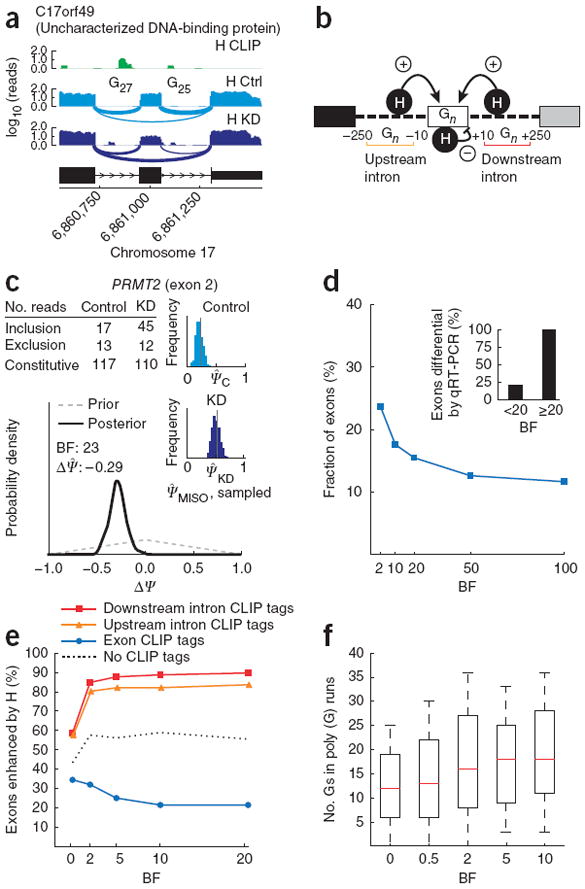
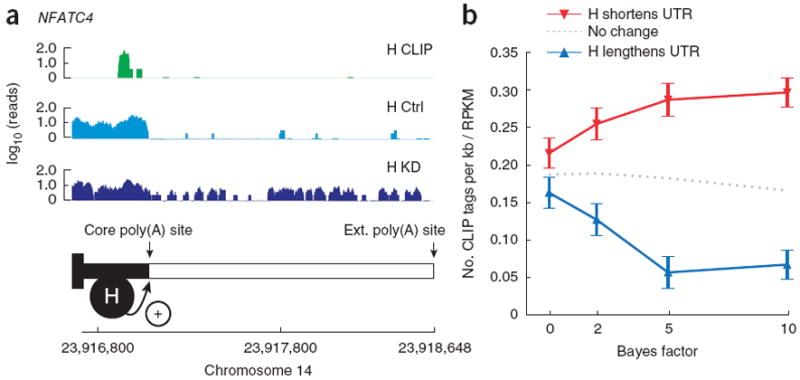
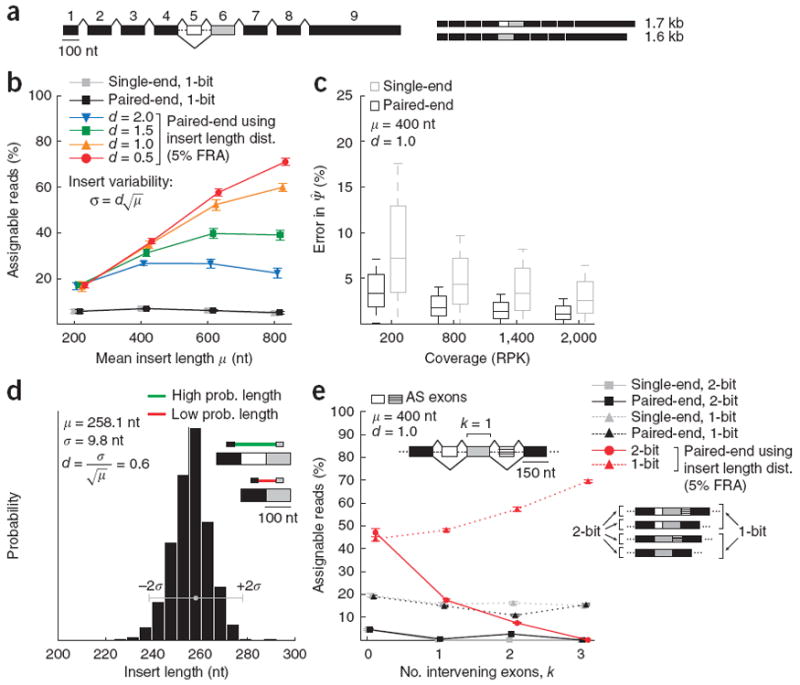
Through alternative splicing, most human genes express multiple isoforms that often differ in function. To infer isoform regulation from high-throughput sequencing of cDNA fragments (RNA-seq), we developed the mixture-of-isoforms (MISO) model, a statistical model that estimates expression of alternatively spliced exons and isoforms and assesses confidence in these estimates. Incorporation of mRNA fragment length distribution in paired-end RNA-seq greatly improved estimation of alternative-splicing levels. MISO also detects differentially regulated exons or isoforms. Application of MISO implicated the RNA splicing factor hnRNP H1 in the regulation of alternative cleavage and polyadenylation, a role that was supported by UV cross-linking-immunoprecipitation sequencing (CLIP-seq) analysis in human cells. Our results provide a probabilistic framework for RNA-seq analysis, give functional insights into pre-mRNA processing and yield guidelines for the optimal design of RNA-seq experiments for studies of gene and isoform expression.


Conflict of interest statement

COMPETING FINANCIAL INTERESTS The authors declare no competing financial interests.

Figures

Figure 1
Figure 1
More accurate inference of splicing levels using MISO. (a) Generative process for MISO model. White, alternatively spliced exon; gray and black, flanking constitutive exons. RNA-seq reads aligning to the alternative exon body (white) or to splice junctions involving this exon support the inclusive isoform, whereas reads joining the two constitutive exons (black-gray exon junction) support the exclusive isoform. Reads aligning to the constitutive exons are common to both isoforms. (b) The Ψ̂SJ estimate uses splice-junction and alternative exon–body reads only. (c) The MISO estimate, Ψ̂MISO (derived here analytically), also uses constitutive reads and paired-end read information; orange lines connect reads in a pair; the insert length distribution is shown at right. (d) Comparison of Ψ̂SJ and Ψ̂MISO estimates from simulated data. Reads were sampled at varying coverage, measured in RPK, from the gene structure shown at top right, with underlying true Ψ = 0.5. Mean values from 3,000 simulations are shown (±s.d.) for each coverage value. Percentiles of gene expression values are shown for a data set assuming 25 million mapped paired-end (PE) read pairs (25M PE; blue, extrapolating from an Illumina GA2 run that yielded 15 million mapped read pairs) and for a data set of 78 million mapped read pairs from an Illumina HiSeq 2000 instrument (78M PE; red), both obtained from human heart tissue.
Figure 2
Figure 2
MISO CIs for Ψ values and qRT-PCR validation. qRT-PCR measurements from ref. for a set of 52 alternatively skipped exons were compared to MISO posterior mean estimates of Ψ, denoted Ψ̂MISO. Full listing of events is given in Supplementary Table 1. (a,b) The Ψ posterior distributions obtained by sampling and 95% CIs are shown for two representative exons, one with a wide (NFYA, exon 3) and one with a narrower (ZNF207, exon 6) CI. qRT-PCR Ψ measurements are indicated in red. (c) Scatterplot of MISO and qRT-PCR Ψ estimates for the full set of 52 events. (d) Scatterplot of MISO and qRT-PCR estimates for the subset of 23 high-confidence events, for which CI width <0.25. One exon was excluded from this plot because of expressed sequence tag (EST) evidence of an alternative isoform expected to confound the qRT-PCR analysis (Supplementary Fig. 6).
Figure 3
Figure 3
Bayes factor analysis of hnRNP H regulation of exon splicing. (a) CLIP tag density (H CLIP; green) and RNA-seq read densities in hnRNP H–knockdown and control conditions (H KD and H Ctrl; light and dark blue, respectively) for an alternative exon in human C17orf49. Number of guanines in poly(G) runs in upstream and downstream introns is shown. (b) Model of hnRNP H function in splicing regulation: binding of poly(G) runs (Gn) adjacent to an exon enhances the exon’s splicing (+ arrows); binding in exon body represses splicing (− arrow). A 250-nt window in flanking introns was used to count CLIP tags in analyses. (c) BF for exon 2 of PRMT2 gene. Gray dashed line, distribution over ΔΨ under the null hypothesis; black solid line, posterior distribution. (d) Cumulative distribution of BFs using hnRNP H RNA-seq data for exons with sufficiently high read coverage. Inset, fraction of differentially regulated exons (ΔΨ ≥ 0.15 by qRT-PCR), grouping exons by BF (n = 25 exons). (e) Percentage of exons enhanced by hnRNP H (ΔΨ > 0), plotted against increasing BF thresholds, for exons with CLIP tags in downstream or upstream introns but not in exon body (red and orange curves), for exons with CLIP tags in exon body but not in flanking introns (blue curve) and for exons with no CLIP tags (dotted black line). (f) Guanines in poly(G) runs in downstream intron, plotted against increasing BFs.
Figure 4
Figure 4
Bayes factor analysis implicates hnRNP H in alternative cleavage and polyadenylation. (a) CLIP tag density (H CLIP; green) and RNA-seq read densities in hnRNP H control and knockdown conditions (H Ctrl and H KD; light and dark blue, respectively) along the 3′ UTR of the NFATC4 gene. Core and extension poly(A) sites for NFATC4 are shown, with a model illustrating the effect of hnRNP H effect on poly(A) site selection. (b) Number of CLIP tags per kilobase normalized by expression (RPKM) for exons with shortened and lengthened UTRs between hnRNP H control and knockdown conditions (red and blue curves, respectively). Values plotted are averages of subsampled mean densities (n = 100 subsamplings) where exons were matched for expression (RPKM). Error bars show s.e.m. CLIP tag density for UTRs not differentially regulated (BF < 1), as shown by dotted gray line.
Figure 5
Figure 5
Improved estimation of isoform abundance using paired-end reads. (a) Representative gene model with 100-nt first exon, 100-nt skipped exon (exon 5, in white), 150-nt constitutive exons and 600-nt last exon. (b) We simulated reads from the two-isoform gene model shown in a while varying the mean, μ, of the insert length distribution, setting the s.d. σ=μ to adjust for the higher variability expected in the size selection for longer fragments. Fraction of 1-bit (assignable to only one isoform) paired and single-end reads is plotted (±s.d.). (c) Distribution of errors for paired-end and single-end estimation as coverage increases (measured in RPK). (d) Histogram shows library insert length distribution computed from read pairs mapped to long constitutive 3′ UTRs in a human testes RNA-seq data set. In the example exon trio shown (similar to that in Fig. 1d), the insert length distribution assigns a higher probability to the top (inclusion) isoform than to the bottom (exclusion) isoform, for which the inferred insert length is improbably small. (e) Fraction of assignable 2-bit and 1-bit reads (±s.d.) for paired-end and single-end reads as a function of the number of intervening constitutive exons, k.

References

    1. Matlin AJ, Clark F, Smith CWJ. Understanding alternative splicing: towards a cellular code. Nat Rev Mol Cell Biol. 2005;6:386–398. - PubMed
    1. Christofk HR, et al. The M2 splice isoform of pyruvate kinase is important for cancer metabolism and tumour growth. Nature. 2008;452:230–233. - PubMed
    1. Rowen L, et al. Analysis of the human neurexin genes: alternative splicing and the generation of protein diversity. Genomics. 2002;79:587–597. - PubMed
    1. Wang ET, et al. Alternative isoform regulation in human tissue transcriptomes. Nature. 2008;456:470–476. - PMC - PubMed
    1. Mortazavi A, Williams BAA, McCue K, Schaeffer L, Wold B. Mapping and quantifying mammalian transcriptomes by RNA-seq. Nat Methods. 2008;5:621–628. - PubMed

Publication types

MeSH terms