. 2010 Dec;11(12):1119-26.
doi: 10.1038/ni.1957. Epub 2010 Nov 7.

A role for IL-27p28 as an antagonist of gp130-mediated signaling

Affiliations

A role for IL-27p28 as an antagonist of gp130-mediated signaling

Jason S Stumhofer et al. Nat Immunol. 2010 Dec.

Abstract

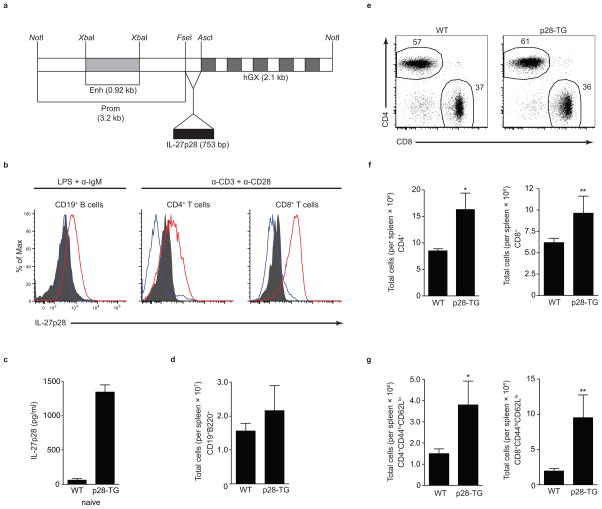
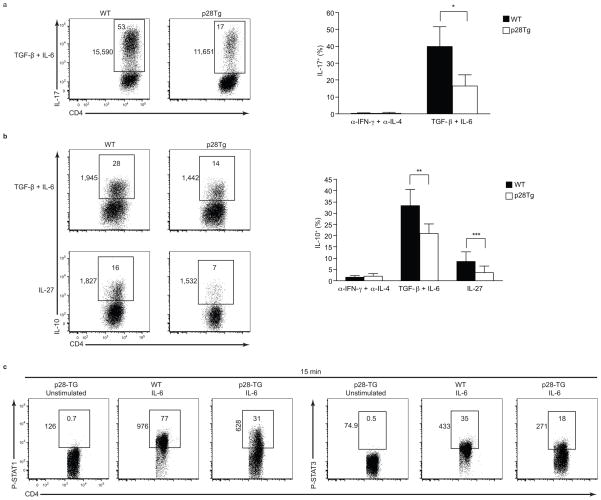
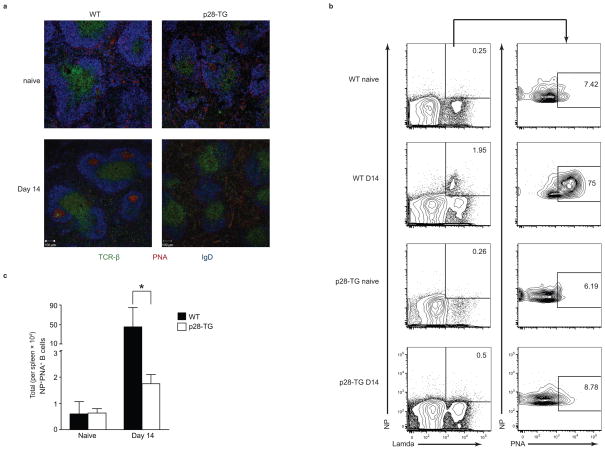
The heterodimeric cytokine interleukin 27 (IL-27) signals through the IL-27Rα subunit of its receptor, combined with gp130, a common receptor chain used by several cytokines, including IL-6. Notably, the IL-27 subunits p28 (IL-27p28) and EBI3 are not always expressed together, which suggests that they may have unique functions. Here we show that IL-27p28, independently of EBI3, antagonized cytokine signaling through gp130 and IL-6-mediated production of IL-17 and IL-10. Similarly, the ability to generate antibody responses was dependent on the activity of gp130-signaling cytokines. Mice transgenic for expression of IL-27p28 showed a substantial defect in the formation of germinal centers and antibody production. Thus, IL-27p28, as a natural antagonist of gp130-mediated signaling, may be useful as a therapeutic for managing inflammation mediated by cytokines that signal through gp130.


Figures

Figure 1
Figure 1
IL-27p28 has biological activity in the absence of EBI3. (a) ELISA of IL-27p28 production by bone-marrow derived dendritic cells and macrophages isolated from wild-type (C57BL/6) or Ebi3−/− mice stimulated with IFN-γ, LPS or the combination of LPS and IFN-γ for 24 h. Data are representative of three independent experiments with similar results. (b) ELISA of IL-27p28 production in the serum of wild-type and Ebi3−/− mice isolated prior to and on day 4, 8 post-infection with T. gondii. Data are representative of three independent experiments with groups of three to four mice (error bars, s.d.). (c, d) Flow cytometry of intracellular IL-17A and IL-10, or ELISA of IL-17 and IL-10 production in CD4+ T cells isolated from the spleen and lymph nodes of wild-type or Ebi3−/− mice, activated with anti-CD3 and anti-CD28 in TH17-polarizing conditions in the presence or absence of IL-27 or IL-27p28 for 4 d. Then the cells were stimulated for 4 h with PMA and ionomycin in the presence of brefeldin A; ELISAs were done after 72 h of stimulation. Numbers in boxes indicate percent IL-17+ or IL-10+ cells. Numbers outside of boxes represent the MFI of IL-17+ or IL-10+ cells. Data are representative of three independent experiments with similar results using groups of two to three mice (error bars, s.d.).
Figure 2
Figure 2
IL-27p28 antagonizes gp130-mediated STAT phosphorylation. (a,b) Flow cytometry of intracellular phosphorylated STAT1 (p-STAT1) or STAT3 (p-STAT3) in CD4+ T cells purified from wild-type mice and stimulated with IL-27p28, IL-6, IL-27 or Hyper-IL-6 for 15 min. Additionally, where indicated IL-27p28 was pre-incubated with T cells for 2 h at 37°C prior to adding IL-6, IL-27 or Hyper-IL-6. Numbers in boxes represent percent CD4+ T cells positive for p-STAT1 or p-STAT3. Numbers outside box represent MFI for p-STAT1 and p-STAT3. Data are representative of four independent experiments with similar results. (c) Three-dimensional model illustrating the interaction of IL-27p28 with gp130 highlighting amino acid residues that are key to this interaction, and which differ between IL-27p28 and IL-6. (d) Flow cytometry of intracellular p-STAT3 in mouse embryonic fibroblasts (MEFs) stimulated with OSM or Hyper-IL-6 (blue histogram) or without stimulation (gray shaded histogram) following 15 min incubation at 37°C. Additionally, IL-27p28 was incubated with MEFs for 2 h at 37°C prior to stimulation with OSM or Hyper-IL-6 (red histogram). Data are representative of three individual experiments with similar results. Box and whiskers plot represents the change in MFI of p-STAT3 in MEFs pre-incubated with IL-27p28 prior to stimulation with OSM or Hyper-IL-6 for 15 min from the five independent experiments. *, P = 0.0059 as determined by an unpaired t test (error bars, s.d.).
Figure 3
Figure 3
Phenotypic analysis of the IL-27p28 transgenic mice. (a) Schematic of the IL-27p28 transgene construct. Functional elements include the juxtaposed lck proximal promoter (Prom) and Eμ enhancer (gray box), the insertion site for IL-27p28 and a mutated (non-translatable) version of the human growth hormone (hGX) gene (alternating black and white boxes represent exons and introns respectively). (b) Flow cytometry to detect intracellular IL-27p28 in wild-type (blue histogram) and p28 transgenic (red histogram) CD19+ B cells or CD4+ and CD8+ T cells following stimulation with LPS and anti-IgM or activation with anti-CD3 and anti-CD28 for 48 h. Cells were incubated with Brefeldin A for 4 h prior to staining. Shaded histogram represents fluorescence minus the PE channel (FMO). (c) ELISA for IL-27p28 in serum of naïve wild-type littermates and p28 transgenic mice. Results are representative of three individual experiments with groups of three to four mice (error bars, s.d.). d) Total CD19+B220+ B cells in the spleen of naïve wild-type littermates and p28 transgenic mice, calculated from percentages determined by flow cytometry. (e) Flow cytometry of splenocytes from naïve wild-type littermates and p28 transgenic mice stained for CD4 and CD8 to determine the ratio of each cell type. Numbers beside outlined areas indicate the percent CD4+CD8 (left) and CD8+CD4 (right) cells. (f) Total CD4+ (left) and CD8+ (right) T cells in the spleen of naïve wild-type littermates and p28 transgenic mice in e, calculated from percentages determined by flow cytometry. *, P = 0.0024. **, P = 0.0148. (g) Total CD4+CD44hiCD62Llo (left) and CD8+CD44hiCD62Llo T cells in the spleen of naïve wild-type littermates and p28 transgenic mice, calculated from percentages determined by flow cytometry. *, P = 0.0062. **, P = 0.0036 (d–g) Results are representative of three independent experiments with groups of two to four mice (error bars, s.d., d, f, g). P values determined by an unpaired t test.
Figure 4
Figure 4
Transgenic overexpression of IL-27p28 antagonizes the activity of IL-6 and IL-27 on CD4+ T cells. (a, b) Flow cytometry (left) for intracellular (a) IL-17A and (b) IL-10 and graph (right) depicting percentage of (a) IL-17+ and (b) IL-10+ CD4+ T cells isolated from the spleen and lymph nodes of wild-type or p28 transgenic mice, activated with anti-CD3 and anti-CD28 in non-polarizing conditions in the presence of (a, b) TGF-β plus IL-6 or (b) IL-27 for 4 d. Cells were stimulated for 4 h with PMA and ionomycin in the presence of brefeldin A. Numbers in boxes indicate percent IL-17A+ or IL-10+ cells, and numbers outside boxes represent the MFI of the IL-17+ and IL-10+ cells. Data are representative of four individual experiments with similar results (error bars, s.d.). *, P = 0.0002. **, P = 0.0009. ***, P = 0.0158. (c) Flow cytometry of intracellular p-STAT1 or p-STAT3 in CD4+ T cells purified from p28 transgenic mice and left unstimulated or stimulated with IL-6 for 15 min. T cells were pre-incubated at 37°C for 2 h prior to addition of IL-6. Numbers in boxes represent percent CD4+ T cells positive for p-STAT1 or p-STAT3. Numbers outside boxes represent MFI for p-STAT1 or p-STAT3. Data are representative of three independent experiments with similar results. P values determined by an unpaired t test.
Figure 5
Figure 5
p28 transgenic mice fail to generate an antigen-specific IgG response following immunization with a TD antigen. (a) ELISPOT to measure the number of antibody secreting cells (ASC) able to bind to NP(33)-BSA in the spleen of naïve wild-type littermate controls and p28 transgenic mice or 5 d after immunization with the TI antigen NP-Ficoll in saline. Results are representative of two independent experiments with groups of two to three mice. (bd) ELISPOT to measure the number of (b) IgM or (c) IgG1 ASC able to bind NP(33)-BSA, or (d) IgG1 ASC able to bind NP(4)-BSA in the spleen of naïve wild-type littermate controls and p28 transgenic mice or 7 and 14 d after immunization with the TD antigen NP-CCG in alum. Results are representative of two (day 7) or three (day 14) independent experiments with groups of three mice. *, P < 0.001. P values determined by a non-parametric Mann Whitney U t test.
Figure 6
Figure 6
Transgenic expression of IL-27p28 blocks formation of GC reactions following immunization with a TD antigen. (a) Sections of spleen from wild-type littermate control and p28 transgenic mice left unimmunized (top) or immunized with NP-CGG in alum, isolated 14 d after immunization and stained with anti-TCR-β-FITC (T cells), PNA conjugated to Rhodamine (GC B cells) and anti-IgD-AlexaFluor 647 (B cell follicles). Original magnification, ×10. Images are representative of two independent experiments with groups of three mice. (b) Flow cytometry to identify PNA+ B cells (right gate) that possess NP bound to lambda light chain (left gate) in the spleen of naïve wild-type littermate control and p28 transgenic mice or 14 d after NP-CGG immunization. Numbers in boxed areas indicate percent lambda+NP+ B cells (left) and NP+PNA+ GC B cells (right). (c) Total number of NP+PNA+ B cells found in each spleen from b, calculated from percentages determined by flow cytometry. (b, c) Results are representative of three independent experiments with groups of three mice. *, P = 0.0049 as determined by an unpaired t test.

References

    1. Kastelein RA, Hunter CA, Cua DJ. Discovery and biology of IL-23 and IL-27: related but functionally distinct regulators of inflammation. Annu Rev Immunol. 2007;25:221–242. - PubMed
    1. Damsker JM, Hansen AM, Caspi RR. Th1 and Th17 cells: adversaries and collaborators. Ann N Y Acad Sci. 1183:211–221. - PMC - PubMed
    1. Jones SA. Directing transition from innate to acquired immunity: defining a role for IL-6. J Immunol. 2005;175:3463–3468. - PubMed
    1. Jones SA, Richards PJ, Scheller J, Rose-John S. IL-6 transsignaling: the in vivo consequences. J Interferon Cytokine Res. 2005;25:241–253. - PubMed
    1. Ding C, Cicuttini F, Li J, Jones G. Targeting IL-6 in the treatment of inflammatory and autoimmune diseases. Expert Opin Investig Drugs. 2009;18:1457–1466. - PubMed

Publication types

MeSH terms