. 2010 Dec;17(12):1470-7.
doi: 10.1038/nsmb.1925. Epub 2010 Nov 7.

Correlated conformational events in EF-G and the ribosome regulate translocation

Affiliations

Correlated conformational events in EF-G and the ribosome regulate translocation

James B Munro et al. Nat Struct Mol Biol. 2010 Dec.

Abstract

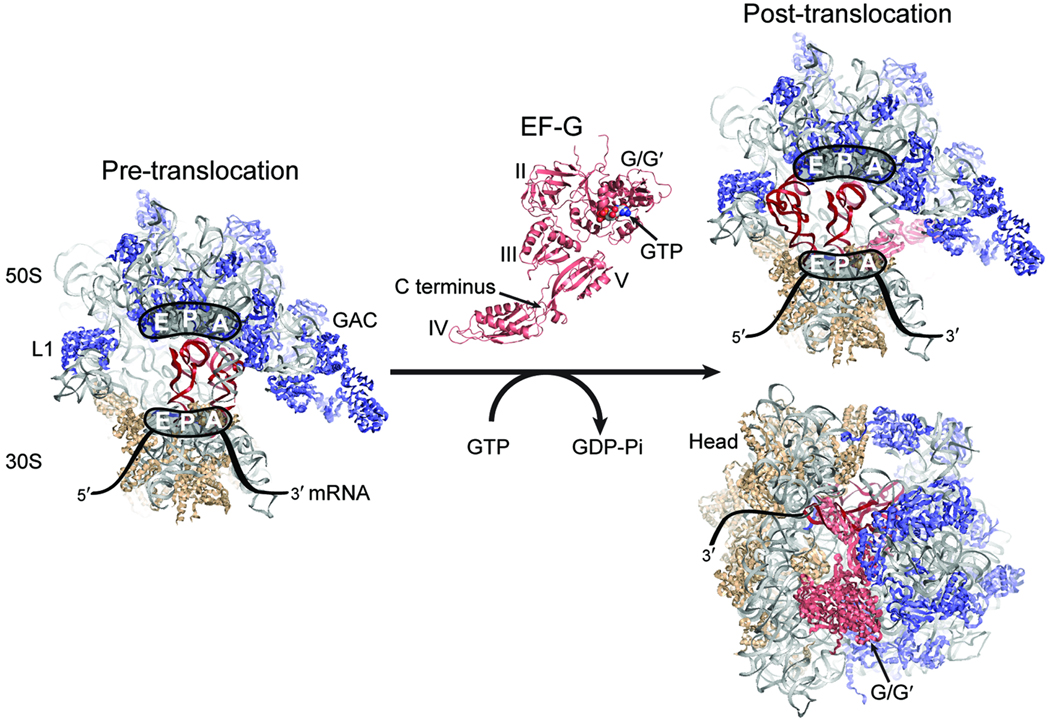
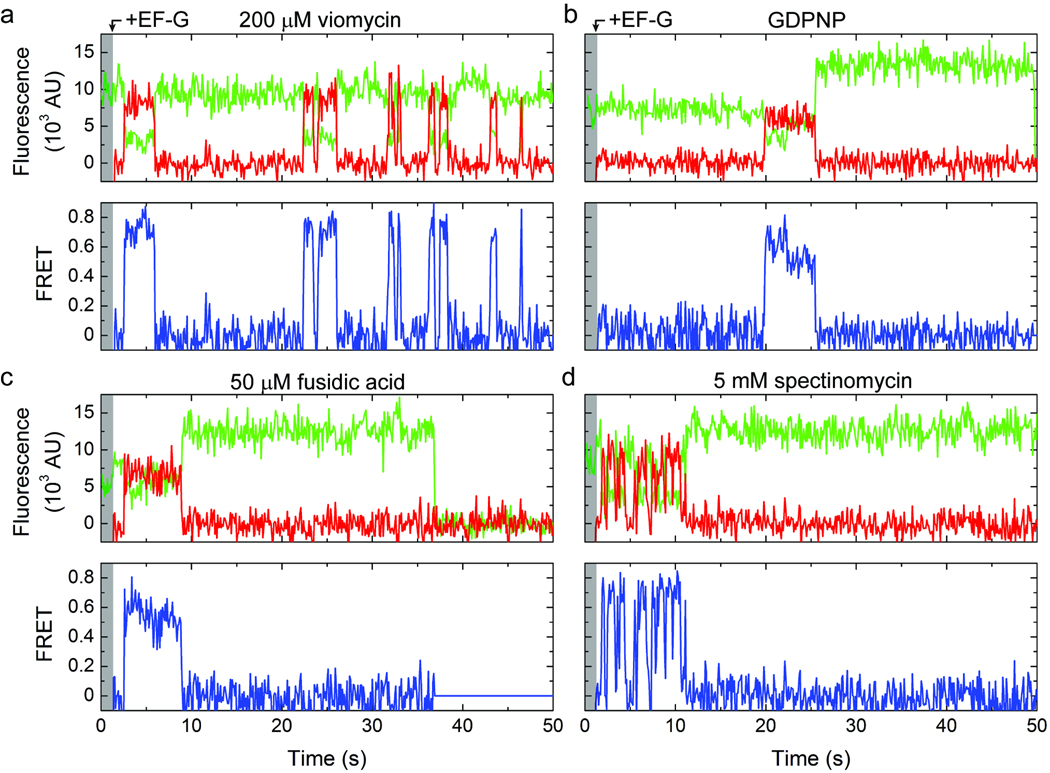
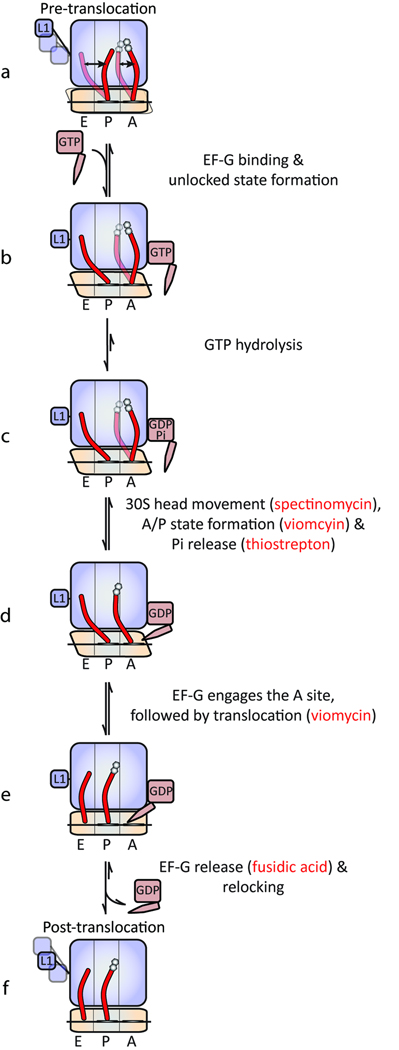
In bacteria, the translocation of tRNA and mRNA with respect to the ribosome is catalyzed by the conserved GTPase elongation factor-G (EF-G). To probe the rate-determining features in this process, we imaged EF-G-catalyzed translocation from two unique structural perspectives using single-molecule fluorescence resonance energy transfer. The data reveal that the rate at which the ribosome spontaneously achieves a transient, 'unlocked' state is closely correlated with the rate at which the tRNA-like domain IV-V element of EF-G engages the A site. After these structural transitions, translocation occurs comparatively fast, suggesting that conformational processes intrinsic to the ribosome determine the rate of translocation. Experiments conducted in the presence of non-hydrolyzable GTP analogs and specific antibiotics further reveal that allosterically linked conformational events in EF-G and the ribosome mediate rapid, directional substrate movement and EF-G release.


Figures

Figure 1
Figure 1. Structural models of the ribosome and EF-G
(Left) The pre-translocation ribosome complex showing the large (50S) and small (30S) subunits, and the A, P, and E sites. The rRNA is shown in grey, the 50S proteins in blue, and the 30S proteins in tan. The A- and P-site tRNAs are in red. The GTPase activating center (GAC) and L1 stalk are indicated. (Center) EF-G with structural domains and GTP labeled. EF-G binds at the GAC of the pre-translocation complex, hydrolyzes GTP, and promotes formation of the post-translocation complex shown at right, in which the tRNAs have moved to the P and E sites and EF-G domains IV/V protrude into the A site. Structural models of the ribosome and EF-G were constructed from PDB accession codes 2WRI and 2WRJ. The A-site tRNA is from PDB 1GIX.
Figure 2
Figure 2. Observation of the translocation reaction from two unique structural perspectives
(a) The dynamics of the ribosome complex with P-site tRNAfMet(Cy3-s4U8), A-site fMet-Phe-tRNAPhe, and L1(Cy5-S55C) following the addition of 10 µM EF-G and 1 mM GTP. (b) The apparent formation of an EF-G-ribosome interaction obtained by delivering 0.2 µM C-terminally labeled EF-G and 1 mM GTP to pre-translocation complexes with P-site tRNAfMet and A-site fMet-Phe-tRNAPhe(Cy3-acp3U47). The intervals Δt, Δtarr and ΔtFRET were used to estimate the apparent rate of translocation, the apparent on-rate konapp, and the apparent off-rate koffapp, respectively. (Left) Cartoon diagrams indicating the sites of labeling (Cy3, green star; Cy5, red star) and the putative dynamic elements. (Right) Single-molecule fluorescence (Cy3, green; Cy5, red) and FRET (blue) trajectories. Overlaid on the FRET traces are the idealizations (red) generated during kinetic analysis (in (a) only).
Figure 3
Figure 3. The kinetics of unlocked state formation and decay and EF-G-ribosome interactions are correlated
Shown here is the distribution of dwell-times leading to the formation of the unlocked state (black), and those leading to the formation of the EF-G-ribosome interaction determined from delivery of labeled EF-G to complexes with labeled A-site tRNA (blue). Also shown is the distribution of the lifetime of the stable unlocked state (red), and that of the EF-G-ribosome interaction (cyan). Overlaid on the distributions are exponential functions with the rate constants shown in Supplementary Table 2. Data is presented for complexes with (a) P-site tRNAfMet and A-site fMet-Phe-tRNAPhe, and (b) P-site tRNAPhe and A-site NAcPhe-Lys-tRNALys.
Figure 4
Figure 4. A step-like increase in Cy3 fluorescence accompanies peptidyl-tRNA movement to the P site
(a) Single-molecule fluorescence trajectories (Cy3, green; Cy5, red) obtained during delivery of 10 µM unlabeled EF-G and 1 mM GTP to complexes with P-site tRNAfMet and A-site fMet-Phe-tRNAPhe(Cy3-acp3U47). (b) The rate of observing the increase in Cy3 fluorescence in complexes with either (blue) P-site tRNAfMet and A-site fMet-Phe-tRNAPhe(Cy3-acp3U47) or (red) P-site tRNAPhe and A-site NAcPhe-Lys-tRNALys(Cy3-acp3U47), across a range of EF-G concentrations (0.05–25 µM). The data were fit to the hyperbolic function Rate = Ratemax[EF − G]/(K1/2 + [EF − G]) with Ratemax = 1.0 ± 0.1 s−1 and K1/2 = 0.9 ± 0.1 µM for the case of P-site tRNAfMet, and Ratemax = 1.7 ± 0.1 s−1 and K1/2 = 0.6 ± 0.1 µM for P-site tRNAPhe. (c) The distribution of time over which the increase in Cy3 fluorescence occurs for complexes containing P-site tRNAfMet. In agreement with a previous report, the distribution is well fit (R2 ≈ 0.95) by the distribution predicted for a model with three successive steps with equal rate constants (f(t) = (k3t2/2) exp(−kt), k = 37 ± 3 s−1). (d) The distribution obtained from complexes containing P-site tRNAPhe was fit to the same function with k = 35 ± 3 s−1 (R2 ≈ 0.94). Error bars represent the standard error.
Figure 5
Figure 5. Translocation in the presence of inhibitors
Single-molecule fluorescence (Cy3, green; Cy5, red) and FRET (blue) trajectories acquired during delivery of labeled EF-G to complexes with labeled A-site tRNAPhe in the presence of (a) 200 µM viomycin, (b) GDPNP, (c) 50 µM fusidic acid or (d) 5 mM spectinomycin.
Figure 6
Figure 6. Schematic of the translocation mechanism highlighting points of antibiotic inhibition

Similar articles

Cited by

References

    1. Agirrezabala X, Frank J. Elongation in translation as a dynamic interaction among the ribosome, tRNA, and elongation factors EF-G and EF-Tu. Q Rev Biophys. 2009;42:159–200. - PMC - PubMed
    1. Shoji S, Walker SE, Fredrick K. Ribosomal Translocation: One Step Closer to the Molecular Mechanism. ACS Chem Biol. 2009;4:93–107. - PMC - PubMed
    1. Wintermeyer W, et al. Mechanisms of elongation on the ribosome: dynamics of a macromolecular machine. Biochem Soc Trans. 2004;32:733–737. - PubMed
    1. Fredrick K, Noller H. Catalysis of ribosomal translocation by sparsomycin. Science. 2003;300:1159–1162. - PubMed
    1. Cukras AR, Southworth DR, Brunelle JL, Culver GM, Green R. Ribosomal proteins S12 and S13 function as control elements for translocation of the mRNA:tRNA complex. Mol Cell. 2003;12:321–328. - PubMed

Publication types

MeSH terms