

doi: 10.1016/j.hal.2010.05.002.
Cyanobacterial Blooms and the Occurrence of the neurotoxin beta-N-methylamino-L-alanine (BMAA) in South Florida Aquatic Food Webs
Affiliations
- PMID: 21057660
- PMCID: PMC2968748
- DOI: 10.1016/j.hal.2010.05.002
Item in Clipboard
Cyanobacterial Blooms and the Occurrence of the neurotoxin beta-N-methylamino-L-alanine (BMAA) in South Florida Aquatic Food Webs
Harmful Algae.
.
Abstract
Recent studies demonstrate that most cyanobacteria produce the neurotoxin beta-N-methylamino-L-alanine (BMAA) and that it can biomagnify in at least one terrestrial food chain. BMAA has been implicated as a significant environmental risk in the development of neurodegenerative diseases such as Alzheimer's disease, Parkinson's disease, and Amyotrophic Lateral Sclerosis (ALS). We examined several blooms of cyanobacteria in South Florida, and the BMAA content of resident animals, including species used as human food. A wide range of BMAA concentrations were found, ranging from below assay detection limits to approximately 7000 μg/g, a concentration associated with a potential long-term human health hazard.
Figures
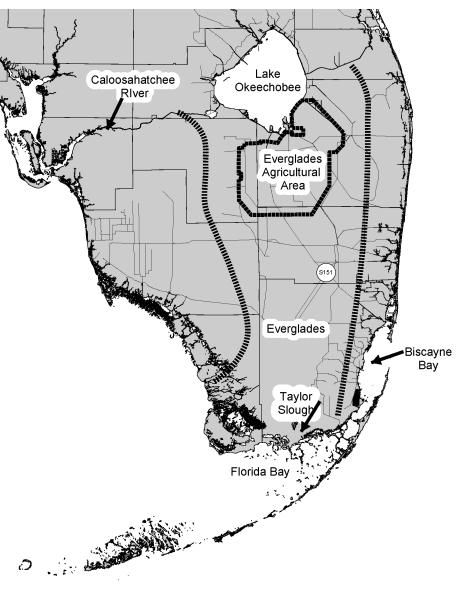
Map of major water bodies in South Florida. Lines of parallel bars indicate general watershed boundaries of the Everglades.
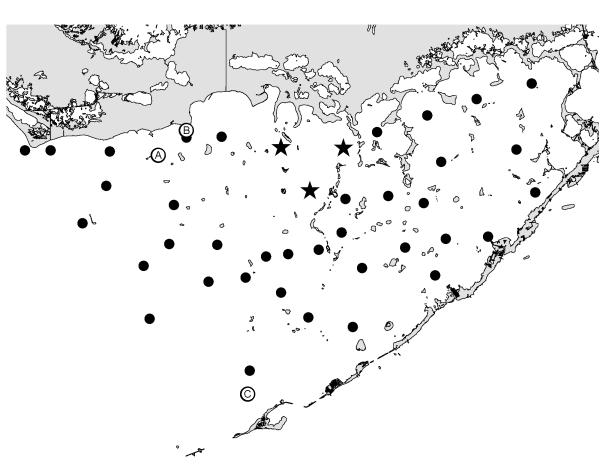
Location of sampling stations in Florida Bay. Dots are water samples. Stars are water samples used in Figure 13. Letters are where animals were collected.
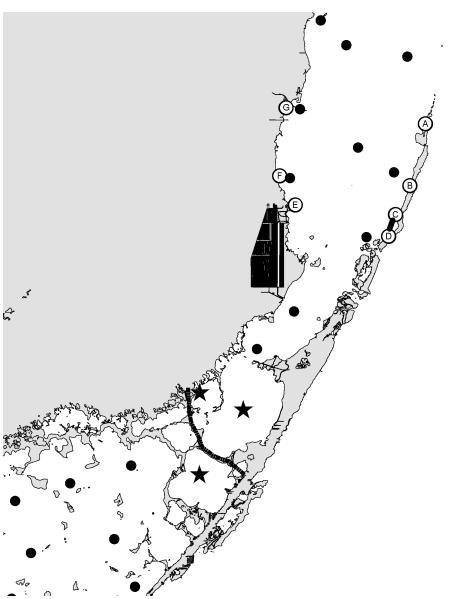
Location of sampling stations in eastern Florida Bay-south Biscayne Bay. Dots are water samples. Stars are water samples used in Figure 15. Letters are where animals were collected. Parallel bars show area where mangrove trees were destroyed.
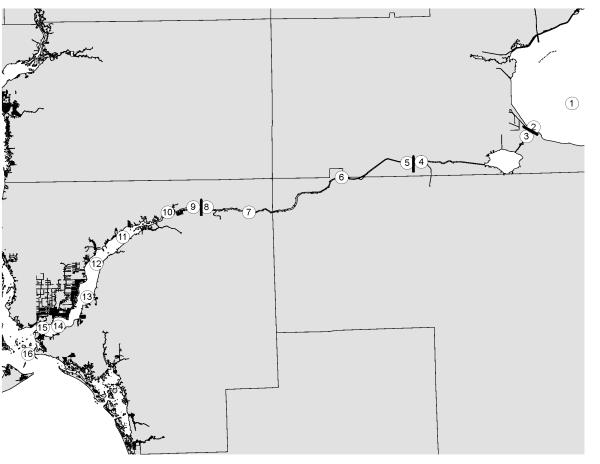
Location of sampling stations along the Caloosahatchee River. Circles are water sampling stations. Bars are dams on the river.
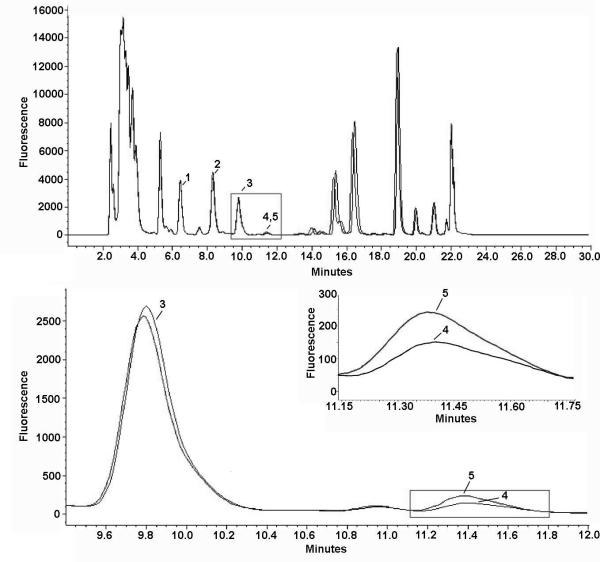
HPLC identification of beta-N-methylamino-L-alanine (L-BMAA) extracted from blue crab (Callinectes sapidus). A) Representative chromatogram of 6-aminoquinolyl-N-hydroxysuccinimidyl carbamate (AQC) tagged amino acids in protein bound extract of muscle from a blue crab (blue trace) taken from Biscayne Bay. Peaks indicated by numbers are the amino acids closest to BMAA: L-tyrosine (1), L-valine (2), and L-methionine(3). The sample chromatographic peak of ACQ-BMAA (4) was confirmed by comparison (black trace, inset) to a co-run identical sample spiked with a known quantity of L-BMAA (100 ng). B) Matrix spiked with L-BMAA and 2,4 DAB synthetic standards. Although DAB is a structural isomer of BMAA, these results demonstrate two distinct chromatographic peaks separated by a later retention time for AQC-tagged DAB.
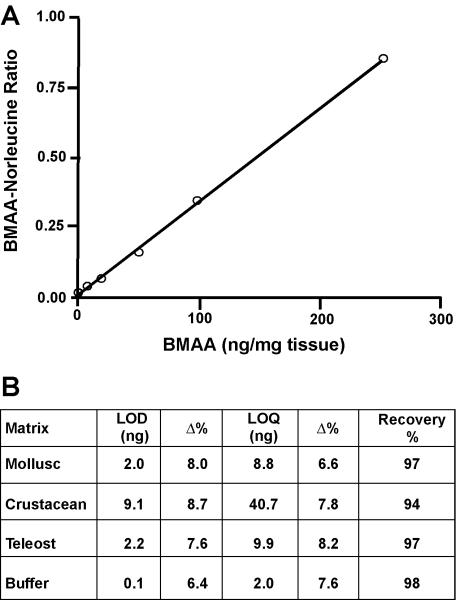
Calibration of the HPLC assay of beta-N-methylamino-L-alanine (BMAA) A. Hydrolyzed protein matrix from a control (BMAA-negative) specimen of Grey snapper (Lutjanus griseus) was spiked with increasing amounts of L-BMAA and compared to spiked norleucine (istd). Neutralized samples derivatized with AQC were analyzed by HPLC without further treatment. Each point represents an average of three runs assayed in duplicate. The response was linear up to 250 ng/mg, r2 = 0.998). B. Validation parameters and results summary from case study of specimens in different phyla. The limit of detection (LOD) and quantitation (LOQ) were validated in HCl extracts of specific matrix protein and compared to buffer blanks to ensure specificity and sensitivity of the quantitation limits. Recovery was determined in control matrix extracts spiked with BMAA prior to acid hydrolysis and compared to the same extract with BMAA added immediately before derivatization with AQC as described in the methods. %CV, Percent Coefficient of variation; %Δ, Percent deviation of the mean from target value.
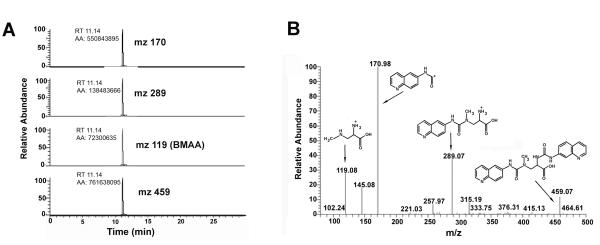
LC/MS/MS identification and verification of L-BMAA in blue crab from Biscayne Bay. A) Triple quadrupole LC/MS/MS verification of BMAA in a representative marine sample (blue crab). Ion chromatograms of product ion from collision induced dissociations of m/z 459. The chromatography of the three major ions produced are: (1) protonated AQC derivative fragment (m/z 171) is the quantitation ion, (2) the protonated-BMAA AQC fragment (m/z 289) is the fist qualifier ion with a ratio of 38% and (3) the protonated-BMAA fragment (m/z 119) is the second qualifier ion with a ratio of 27%. B) Full product ion scan of an injection of AQC derivatized BMAA (217 fmole) in LC/MS/MS. Spectrum shows the dissociation of m/z 459 at 20 V.
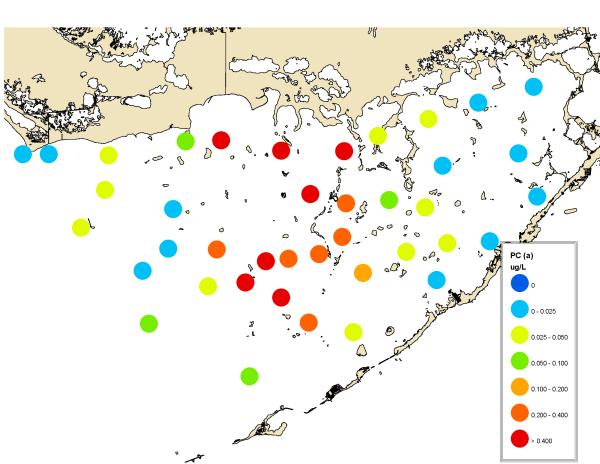
Average abundance of cyanobacteria in Florida Bay in 2000-2008 measured monthly as phycocyanin concentration.
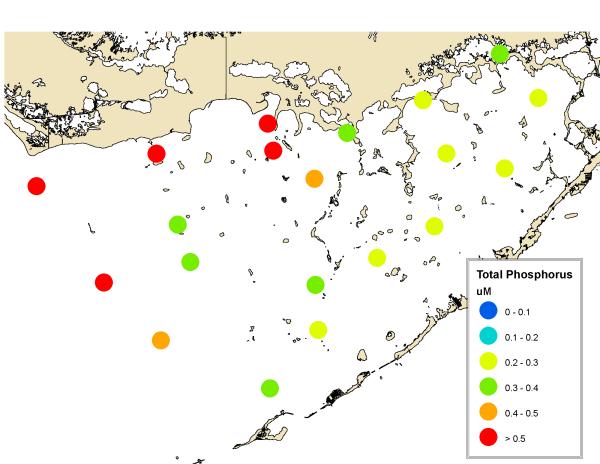
Average distribution of total phosphorus in Florida Bay in 2000-2008. Monthly data from the South Florida Water Management District.
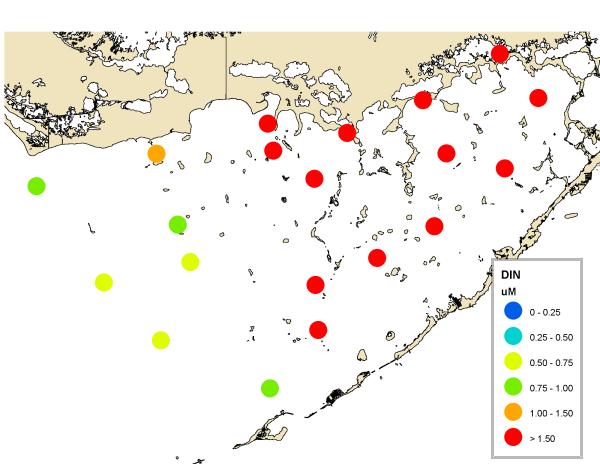
Average distribution of inorganic nitrogen (nitrate, nitrite, and ammonia) in Florida Bay in 2000-2008. Monthly data from the South Florida Water Management District.
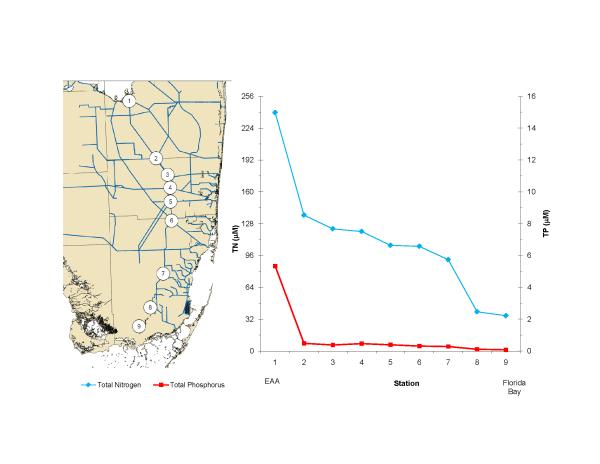
Transect of average nitrogen and phosphorus concentrations in 2008 from the Everglades Agricultural Area (EAA) through the Everglades into Florida Bay. Note that the scales for nitrogen and phosphorus are adjusted to the Redfield ratio of 16:1. These data show that phosphorus is the limiting nutrient in the Everglades. Monthly data from the South Florida Water Management District.
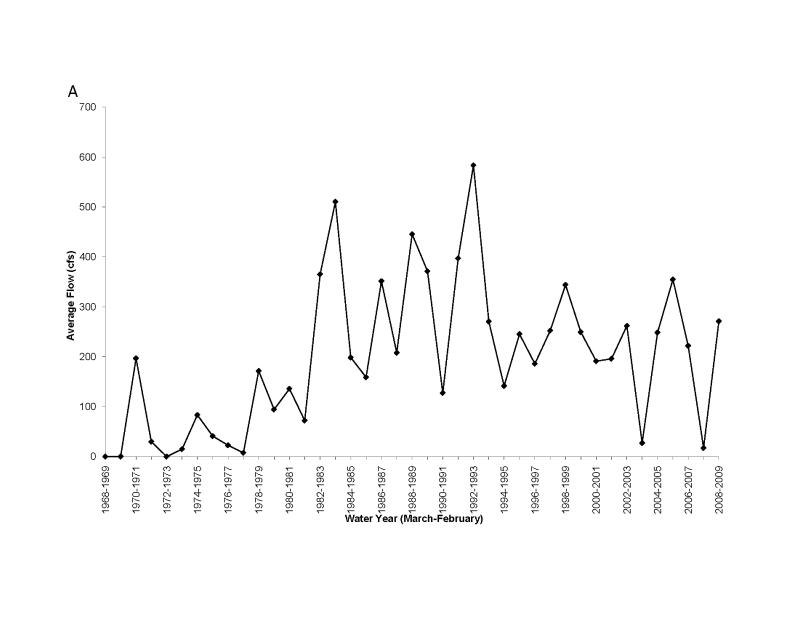
Long term changes in water flow from the Everglades Agricultural Area to Florida Bay, as measured at S151 (A) and Taylor Slough (B) (locations shown in Fig. 1). Data from the South Florida Water Management District.
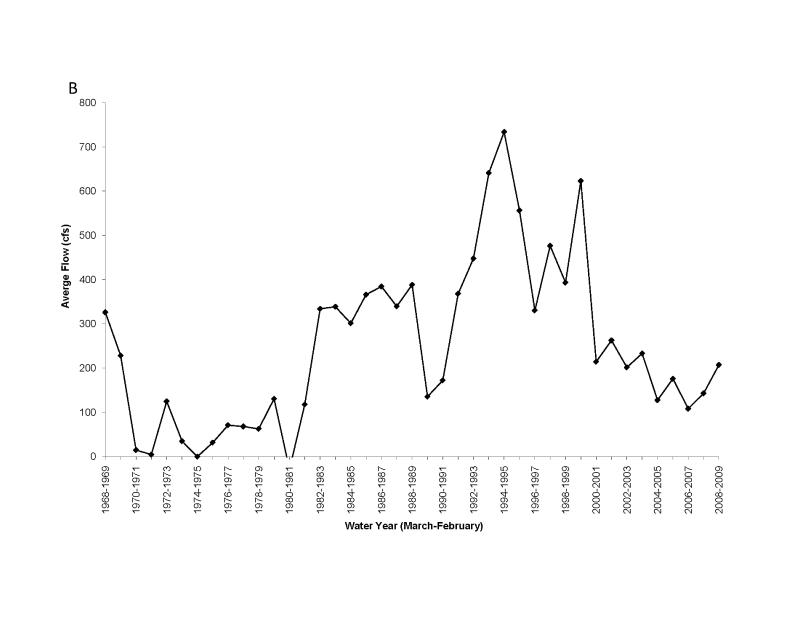
Long term changes in water flow from the Everglades Agricultural Area to Florida Bay, as measured at S151 (A) and Taylor Slough (B) (locations shown in Fig. 1). Data from the South Florida Water Management District.
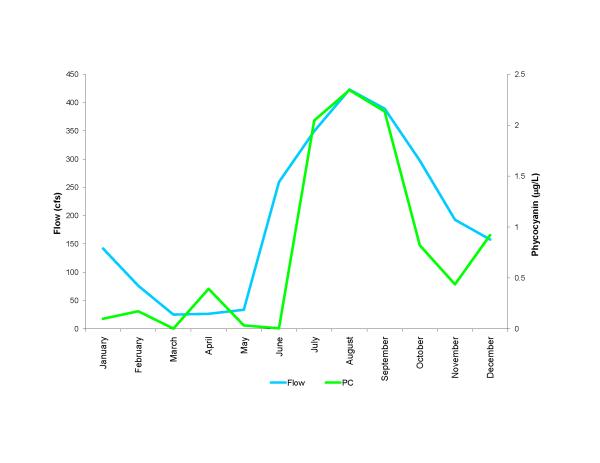
Average seasonal flow of water into Florida Bay and concentrations of cyanobacteria (measured as phycocyanin) over the 2000 to 2008 time period. Flow data from the South Florida Water Management District.
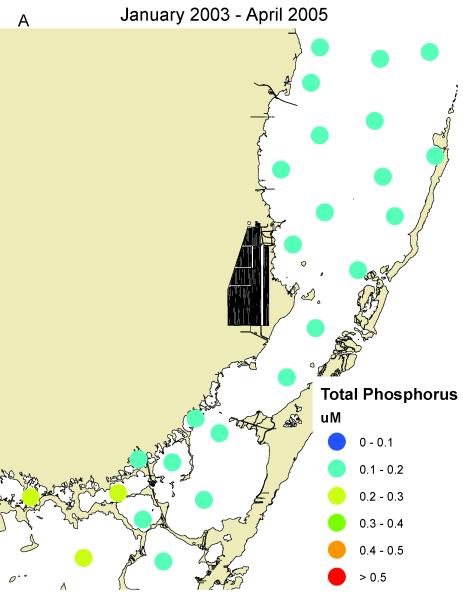
Concentrations of total phosphorus and cyanobacteria (measured as phycocyanin) in eastern Florida Bay-south Biscayne Bay. A. Total phosphorus before mangrove destruction. B. Total phosphorus after mangrove destruction. C. Cyanobacteria before mangrove destruction. D. Cyanobacteria after mangrove destruction. Total phosphorus concentrations from South Florida Water Management District.
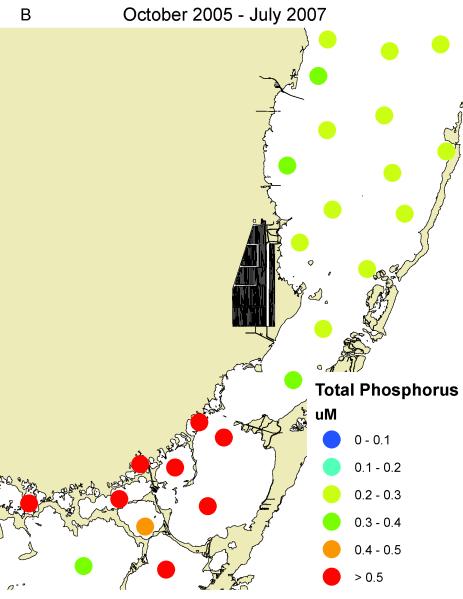
Concentrations of total phosphorus and cyanobacteria (measured as phycocyanin) in eastern Florida Bay-south Biscayne Bay. A. Total phosphorus before mangrove destruction. B. Total phosphorus after mangrove destruction. C. Cyanobacteria before mangrove destruction. D. Cyanobacteria after mangrove destruction. Total phosphorus concentrations from South Florida Water Management District.
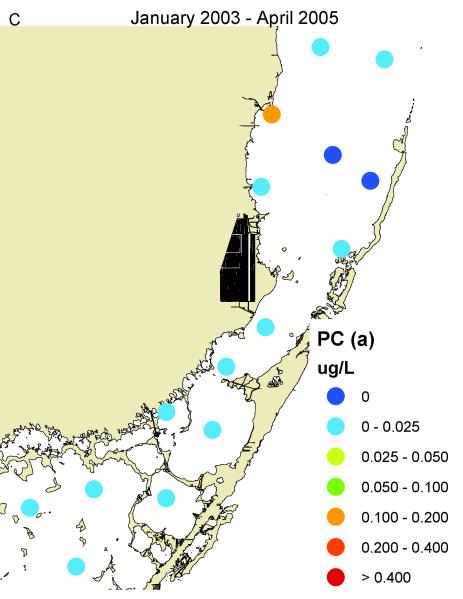
Concentrations of total phosphorus and cyanobacteria (measured as phycocyanin) in eastern Florida Bay-south Biscayne Bay. A. Total phosphorus before mangrove destruction. B. Total phosphorus after mangrove destruction. C. Cyanobacteria before mangrove destruction. D. Cyanobacteria after mangrove destruction. Total phosphorus concentrations from South Florida Water Management District.
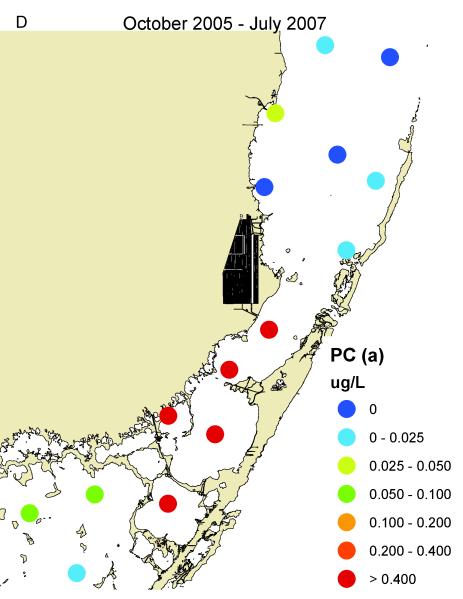
Concentrations of total phosphorus and cyanobacteria (measured as phycocyanin) in eastern Florida Bay-south Biscayne Bay. A. Total phosphorus before mangrove destruction. B. Total phosphorus after mangrove destruction. C. Cyanobacteria before mangrove destruction. D. Cyanobacteria after mangrove destruction. Total phosphorus concentrations from South Florida Water Management District.
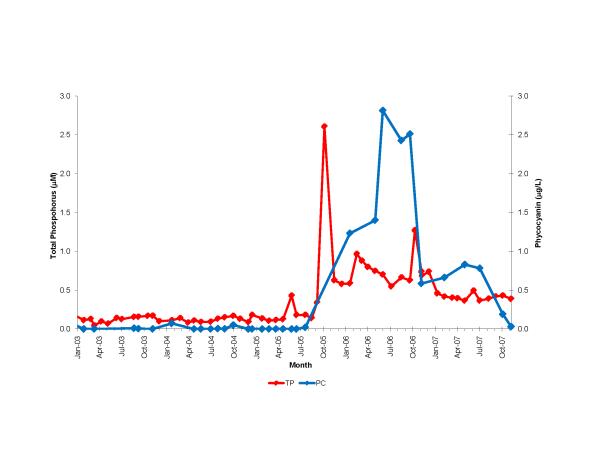
Time course of total phosphorus and cyanobacteria (measured as phycocyanin) at locations (stars) shown in Fig. 3 in the area of mangrove destruction. Total phosphorus data from South Florida Water Management District.
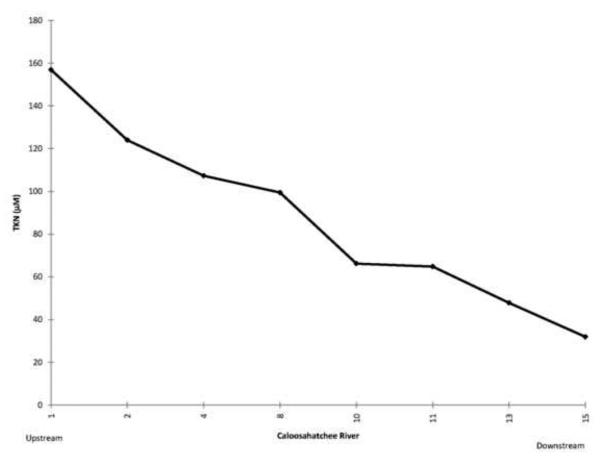
Average concentrations of total nitrogen along the Caloosahatchee River from Lake Okeechobee to Sanibel Island May-December, 2008. Monthly data from South Florida Water Management District.
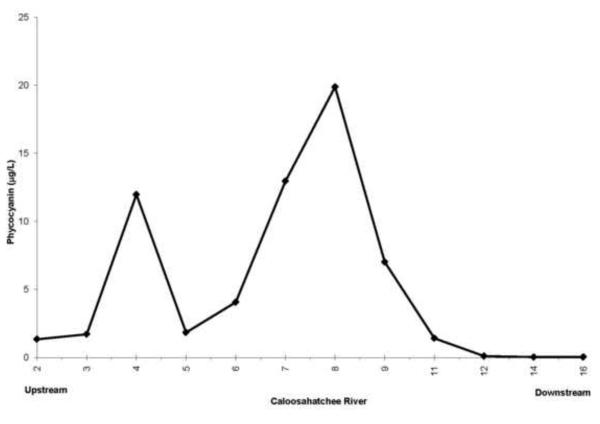
Average concentrations of cyanobacteria (measured as phycocyanin) along the Caloosahatchee River from Lake Okeechobee to Sanibel Island May-December, 2008.
References
-
- Allen CN, Omelchenko I, Ross SM, Spencer P. The neurotoxin beta-N-methylamino-L-alanine (BMAA) interacts with the strychnine-insensitive glycine modulatory site of the N-methyl-D-aspartate receptor. Neuropharm. 1995;34:651–658. - PubMed
-
- Anderson DM, Glibert PM, Burkholder JM. Harmful algal blooms and eutrophication: nutrient sources, composition, and consequences. Estuaries. 2002;25:704–726.
-
- Arnot JA, Gobas FAPC. A review of bioconcentration factor (BCF) and bioaccumulation factor (BAF) assessments for organic chemicals in aquatic organisms. Env. Rev. 2006;14:257–297.
-
- Banack SA, Cox PA. Biomagnification of cycad neurotoxins in flying foxes. Neurol. 2003;61:387–389. - PubMed
Grants and funding
LinkOut - more resources
Full Text Sources
Other Literature Sources
Miscellaneous
