. 2010 Nov 8:10:614.
doi: 10.1186/1471-2407-10-614.

Regulation of sonic hedgehog-GLI1 downstream target genes PTCH1, Cyclin D2, Plakoglobin, PAX6 and NKX2.2 and their epigenetic status in medulloblastoma and astrocytoma

Affiliations

Regulation of sonic hedgehog-GLI1 downstream target genes PTCH1, Cyclin D2, Plakoglobin, PAX6 and NKX2.2 and their epigenetic status in medulloblastoma and astrocytoma

Mehdi H Shahi et al. BMC Cancer. .

Abstract

Background: The Sonic hedgehog (Shh) signaling pathway is critical for cell growth and differentiation. Impairment of this pathway can result in both birth defects and cancer. Despite its importance in cancer development, the Shh pathway has not been thoroughly investigated in tumorigenesis of brain tumors. In this study, we sought to understand the regulatory roles of GLI1, the immediate downstream activator of the Shh signaling pathway on its downstream target genes PTCH1, Cyclin D2, Plakoglobin, NKX2.2 and PAX6 in medulloblastoma and astrocytic tumors.

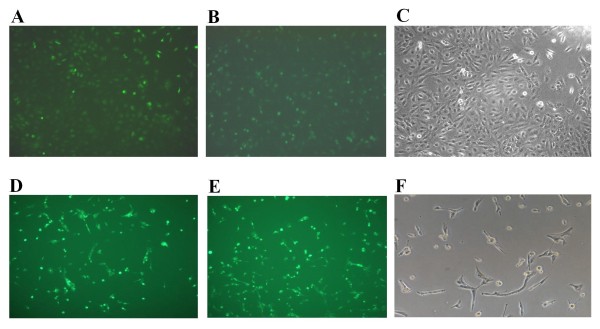
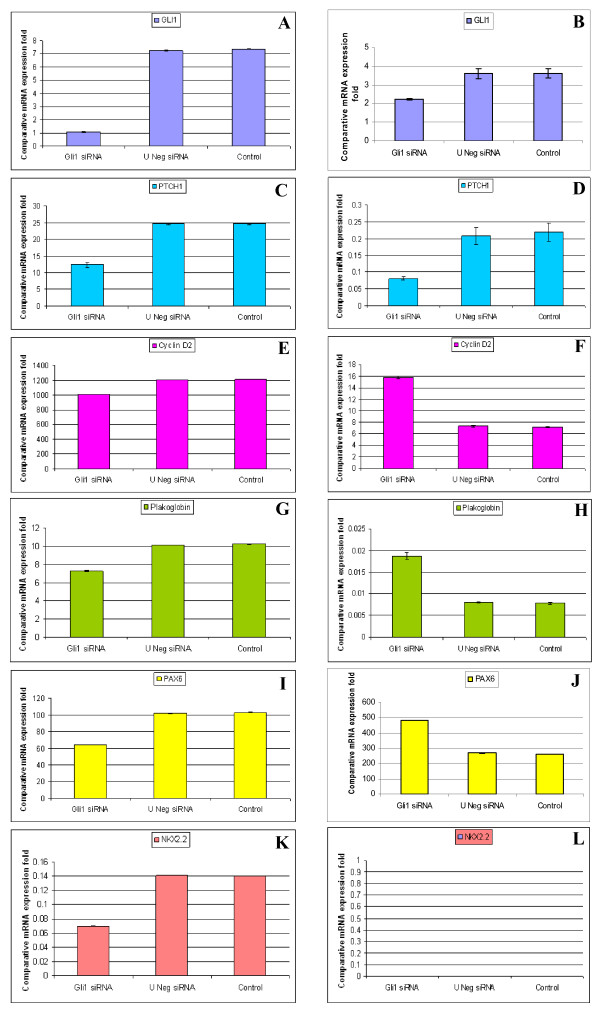
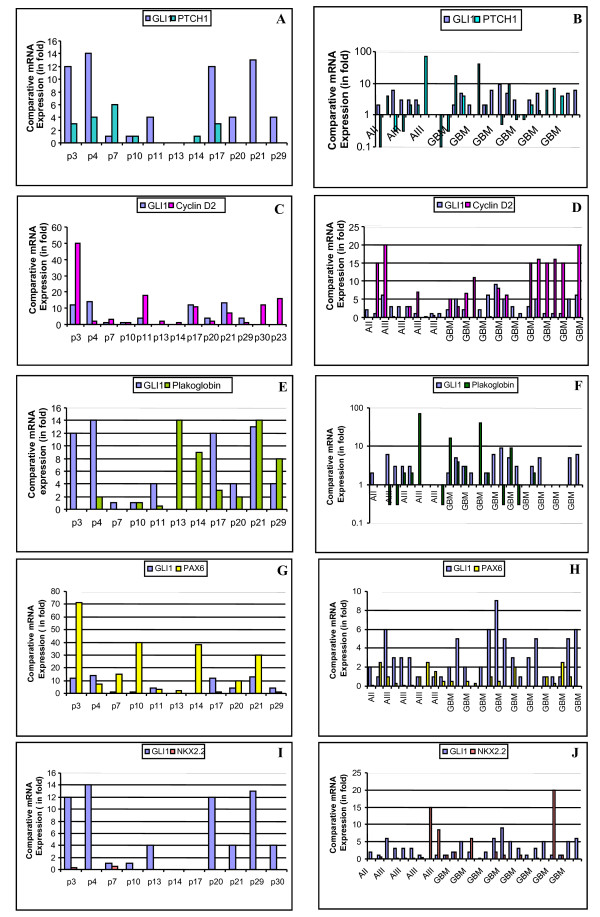
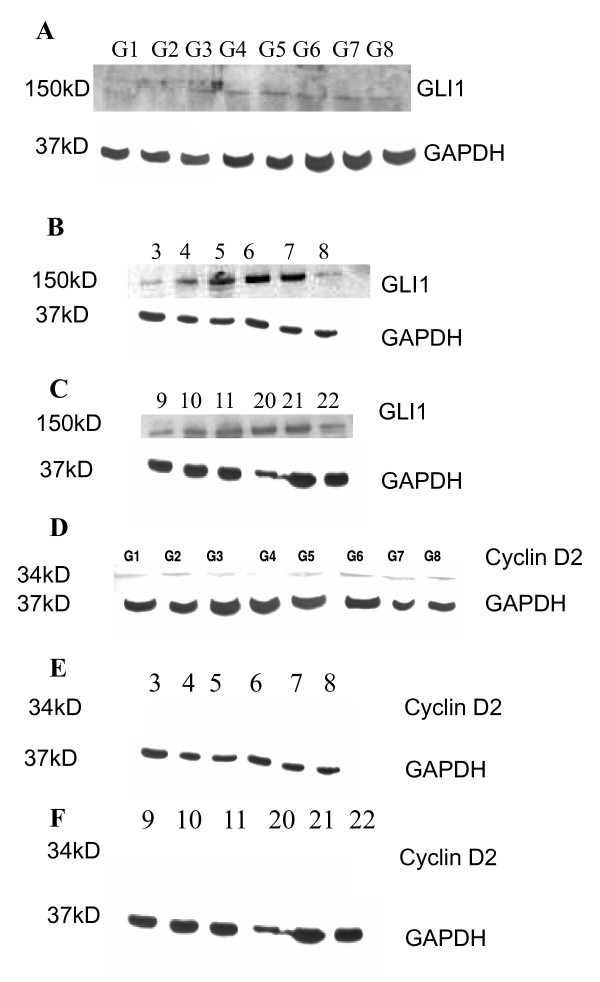
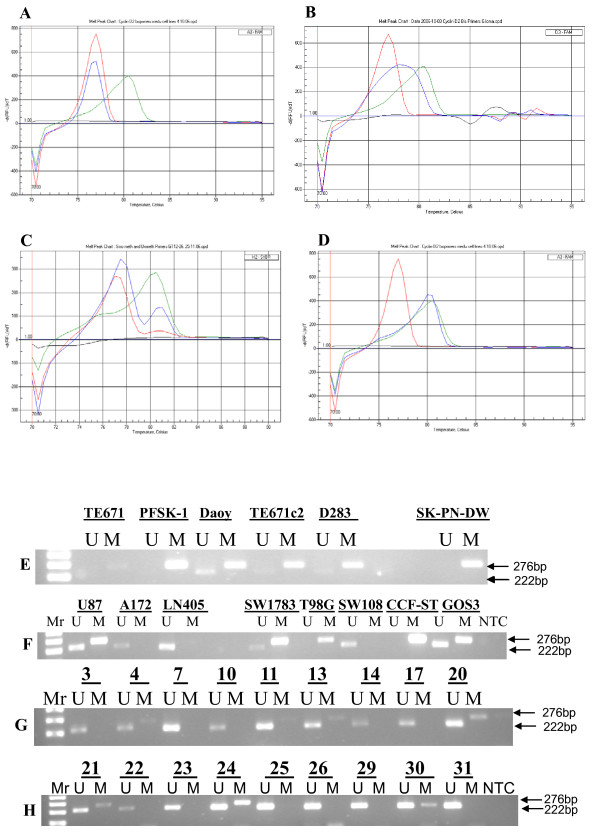
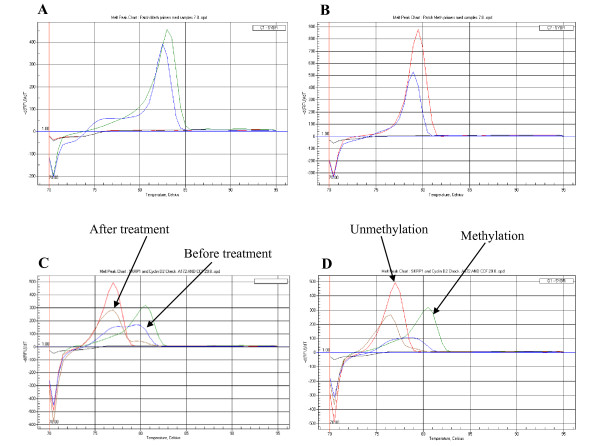
Methods: We silenced GLI1 expression in medulloblastoma and astrocytic cell lines by transfection of siRNA against GLI1. Subsequently, we performed RT-PCR and quantitative real time RT-PCR (qRT-PCR) to assay the expression of downstream target genes PTCH1, Cyclin D2, Plakoglobin, NKX2.2 and PAX6. We also attempted to correlate the pattern of expression of GLI1 and its regulated genes in 14 cell lines and 41 primary medulloblastoma and astrocytoma tumor samples. We also assessed the methylation status of the Cyclin D2 and PTCH1 promoters in these 14 cell lines and 58 primary tumor samples.

Results: Silencing expression of GLI1 resulted up-regulation of all target genes in the medulloblastoma cell line, while only PTCH1 was up-regulated in astrocytoma. We also observed methylation of the cyclin D2 promoter in a significant number of astrocytoma cell lines (63%) and primary astrocytoma tumor samples (32%), but not at all in any medulloblastoma samples. PTCH1 promoter methylation was less frequently observed than Cyclin D2 promoter methylation in astrocytomas, and not at all in medulloblastomas.

Conclusions: Our results demonstrate different regulatory mechanisms of Shh-GLI1 signaling. These differences vary according to the downstream target gene affected, the origin of the tissue, as well as epigenetic regulation of some of these genes.


Figures

Figure 1
Figure 1
Transfection of Daoy medulloblastoma cell line and U87MG astrocytoma cell line with GLI1 siRNA. Figure 1A: Daoy cell line is transfected with Stealth GLI1 siRNA (Invitrogen) with 100 pmol concentration, using Lipofectamine™ 2000 as a transfecting agent and fluorescein-labeled oligo (BLOCK-iT™ Fluorescent oligo) for identification of trasfection efficency. Figure 1B: Daoy cell line transfected with universal negative (U neg) siRNA. Figure 1C: Untransfected Daoy cell line. Figure 1D: U87MG cell line is transfected with Stealth GLI1 siRNA (Invitogen) with 100 pmol concentration, using Lipofectamine™ 2000 as a transfecting agent and fluorescein-labeled oligo (BLOCK-iT™ Fluorescent oligo) for identification of trasfection efficency. Figure 1E: U87MG cell line transfected with universal negative (U neg) siRNA. Figure 1F: Untransfected U87MG cell line.
Figure 2
Figure 2
qRT-PCR comparative expression of GLI1, PTCH1, Cyclin D2, Plakoglobin, PAX6 and NKX2.2 genes in GLI1 knock-down, negative and untransfected Daoy medulloblastoma cell line and U87MG astrocytoma cell line. After 72 h of siRNA-mediated transfection, GLI1 showed 83% decrease in expression in Daoy cell line (Figure 2A) and 40-45% decrease in expression in U87MG cell line (Figure 2B) compared to universal negative siRNA and untransfected cell lines. The siRNA-mediated GLI1 knock-down cell lines Daoy and U87MG showed 50% (Figure 2C) and 60% (Figure 2D) decrease in expression of PTCH1 respectively. The GLI1 knock-down cell lines (Daoy and U87MG) showed 17% decrease (Figure 2E) and 113% increase (Figure 2F) in expression of Cyclin D2 respectively. The cell lines Daoy and U87MG showed 30% decrease (Figure 2G) and 125% increase (Figure 2H) in expression of Plakoglobin respectively, compared to universal negative siRNA and untransfected cell lines. The knock-down cell lines (Daoy and U87MG) showed 35% decrease (Figure 2I) and 100% increase (Figure 2J) in expression of PAX6 respectively, compared to universal negative and untransfected cell lines. We further checked the expression of NKX2.2 in these two GLI1 knock-down cell lines (Daoy and U87MG) and found 50% decrease (Figure 2K) and not any changes in the expression of NKX2.2 (Figure 2L) respectively, compared to universal negative and untransfected cell lines.
Figure 3
Figure 3
qRT-PCR comparative expression of GLI1, PTCH1, Cyclin D2, Plakoglobin, PAX6 and NKX2.2 in medulloblastoma and astrocytic primary tumor samples. Figure 3A: Most of the medulloblastoma primary tumor samples show high fold GLI1 transcript expression, but PTCH1 expression does not associate. Figure 3B: Most of the astrocytic primary tumor samples showed high fold GLI1 transcript expression but PTCH1 expression is low in most of the primary samples. Figure 3C: Most of the medulloblastoma samples show high expression of GLI1 and Cyclin D2. Figure 3D: No distinct pattern of Cyclin D2 expression in GBM samples. However, grade III astrocytoma samples show low expression in the presence of high GLI1 expression. Figure 3E: In case of Plakoglobin there is a reverse relationship in expression of GLI1 in medulloblastoma except samples 10 and 21. Figure 3F: Low-grade astrocytoma samples do not show Plakoglobin expression, and high-grade astrocytoma samples show Plakoglobin expression in the absence of GLI1 expression. Figure 3G: Reverse correlation between GLI1 and PAX6 transcript expression among medulloblastoma samples. Figure 3H: In the presence of high GLI1, there is low expression of PAX6 among astrocytic samples. Figure 3I: There is not any expression of NKX2.2 among medulloblastoma tumor samples. Figure 3J: Most of the astrocytic tumor samples show low/absence of expression of NKX2.2 in the presence of GLI1.
Figure 4
Figure 4
qRT-PCR comparative expression of Cyclin D2, Plakoglobin, PAX6 and NKX2.2 in medulloblastoma and astrocytoma cell lines (for GLI1 and PTCH1, please check reference [26]). Figure 4A: All 6 medulloblastoma cell lines show equal expression of Cyclin D2 as compared to normal adult brain tissue; interestingly normal brain itself shows high expression of Cyclin D2. Figure 4B: Four astrocytic cell lines show very low expression and the remaining 4 cell lines show no expression of Cyclin D2 transcript as compared to normal adult brain tissue (p < 0.001). Figure 4C: All 6 medulloblastoma cell lines show high fold expression of Plakoglobin compared to normal adult brain tissue. Figure 4D: Five astrocytic cell lines show low expression of Plakoglobin transcript compared to normal brain tissue. Figure 4E: Only one medulloblastoma cell line, TE671c2, shows high expression fold of PAX6 as compared to normal adult brain tissue. Figure 4F: Most of the astrocytoma cell lines, except U87MG and LN405, show low expression of PAX6 transcript compared to normal brain tissue. Figure 4G: Most of the medulloblastoma cell lines show no/low expression of NKX2.2 except SK-PN-DW, as compared to normal adult brain tissue. Figure 4H: All 8 astrocytic cell lines show no/low expression of NKX2.2 transcript compared to normal brain tissue. SYBER Green dye was used for the quantification of cDNA by qRT-PCR. Comparative expression of samples was plotted on Y-axis with Log10.
Figure 5
Figure 5
Protein expression of GLI1 and Cyclin D2 in astrocytic cell lines and tumor samples. Figure 5A: The first two cell lines (G1: U87MG and G2: A172) do not show very distinct bands, but the remaining 6 cell lines (G3: LN405, G4: SW1783, G5: T98G, G6: SW1088, G7: CCF-STTG-1 and G8: GOS-3) show distinct bands of GLI1 protein. Figures 5B and Figure 5C show GLI1 protein expression in astrocytic tumor samples 3-8 and 9, 10, 11, 20, 21 and 22. Figure 5D: Low protein expression of Cyclin D2 in astrocytic cell lines G1: U87MG, G2: A172, G3: LN405, G5: T98G, G6: SW1088, G7: CCF-STTG-1 and G8: GOS-3. Only one cell line (G4: SW1783) does not express Cyclin D2 protein. Figures 5E and Figure 5F: Cyclin D2 protein expression is not shown in astrocytic tumor samples (3-8 and 9, 10, 11, 20, 21 and 22).
Figure 6
Figure 6
Reversal of Cyclin D2 expression after treatment with demethylating agent 5-Aza-2'-deoxycytidine and TSA. Figure 6A: All 5 cell lines (A172, SW1783, T98G, CCF and GOS-3) show reversal in the expression of Cyclin D2 by RT-PCR. -: before treatment; +: after treatment. Figure 6B: Reversal of expression of Cyclin D2 transcript in the 5 cell lines after the treatment with 5-Aza-2'-dC and TSA, by qRT-PCR. Figure 6C: Comparative fold expression of Cyclin D2 after the treatment with 5-Aza-2'-dC and TSA. Some astrocytic cell lines even showed 200 fold increase in Cyclin D2 expression (p = 0.0014).
Figure 7
Figure 7
Promoter methylation analysis of Cyclin D2. 7A-D: Medulloblastoma and astrocytoma cell lines unmethylation melting curve pattern (Figure 7A); hemi-methylation curve pattern (Figure 7B); partial methylation curve pattern (Figure 7C); and complete methylation curve (Figure 7D) of Cyclin D2 promoter shown by the MCA-Meth method. Figure 7E: Cyclin D2 promoter methylation in medulloblastoma cell lines by MSP. Three cell lines (Daoy, TE671c2 and D283) show hemimethylation (U+M) and the remaining three cell lines (TE671, PFSK-1 and SK-PN-DW) show complete methylation (M). Unmethylated and methylated PCR product bands are 222 and 276 bp, respectively. Figure 7F: Among astrocytic cell lines three of them (U87MG, SW1783 and GOS-3) show hemi-methylation; 2 show complete methylation (M) (T98G and CCF-STTG-1); and the other 2 (A172 and LN405) show no methylation (U). Figure 7G: Promoter methylation analysis of medulloblastoma samples. Figure 7H: Promoter methylation analysis of astrocytoma samples.
Figure 8
Figure 8
PTCH1 promoter methylation analysis. Figure 8A: PTCH1 promoter methylation curve by MCA-MSP. Figure 8B: PTCH1 promoter unmethylation curve. Melting curve shown by MCA-Meth. Figure 8C-D. Reversal of methylation melting curve after the treatment with 5-Aza-2'-dC and TSA in CCF-STTG-1 (Figure 8C) and GOS-3 (Figure 8D) astrocytic cell lines.

Similar articles

Cited by

References

    1. Dahmane N, Ruiz i Altaba A. Sonic hedgehog regulates the growth and patterning of the cerebellum. Development. 1999;126:3089–3100. - PubMed
    1. Podlasek CA, Barnett DH, Clemens JQ, Bak PM, Bushman W. Prostate development requires Sonic hedgehog expressed by the urogenital sinus epithelium. Dev Biol. 1999;209:28–39. doi: 10.1006/dbio.1999.9229. - DOI - PubMed
    1. Mo R, Freer AM, Zinyk DL, Crackower MA, Michaud J, Heng HH, Chik KW, Shi XM, Tsui LC, Cheng SH, Joyner AL, Hui C. Specific and redundant functions of Gli2 and Gli3 zinc finger genes in skeletal patterning and development. Development. 1997;124:113–123. - PubMed
    1. Buscher D, Bosse B, Heymer J, Ruther U. Evidence for genetic control of Sonic hedgehog by Gli3 in mouse limb development. Mech Dev. 1997;62:175–182. doi: 10.1016/S0925-4773(97)00656-4. - DOI - PubMed
    1. Palma V, Lim DA, Dahmane N, Sanchez P, Brionne TC, Herzberg CD, Gitton Y, Carleton A, Alvarez-Buylla A, Ruiz i Altaba A. Sonic hedgehog controls stem cell behavior in the postnatal and adult brain. Development. 2005;132:335–344. doi: 10.1242/dev.01567. - DOI - PMC - PubMed

Publication types

MeSH terms

Substances