. 2011 Jan 14;405(2):361-77.
doi: 10.1016/j.jmb.2010.10.001. Epub 2010 Nov 6.

Structural origins of high apparent dielectric constants experienced by ionizable groups in the hydrophobic core of a protein

Affiliations

Structural origins of high apparent dielectric constants experienced by ionizable groups in the hydrophobic core of a protein

Michael S Chimenti et al. J Mol Biol. .

Abstract

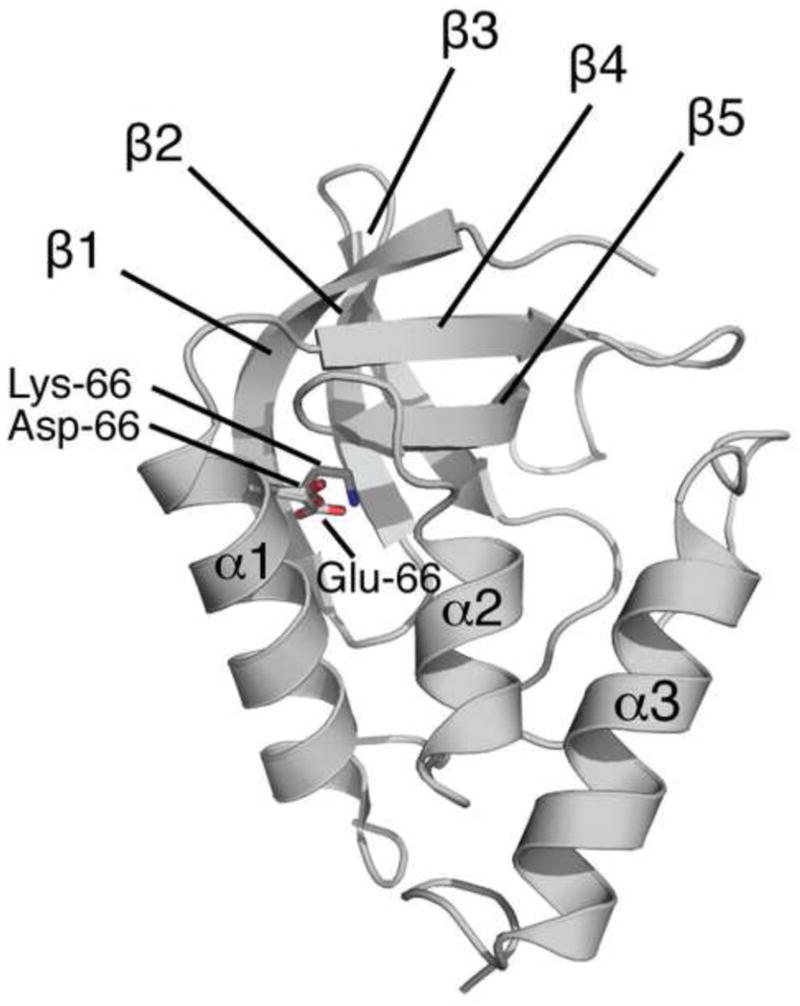
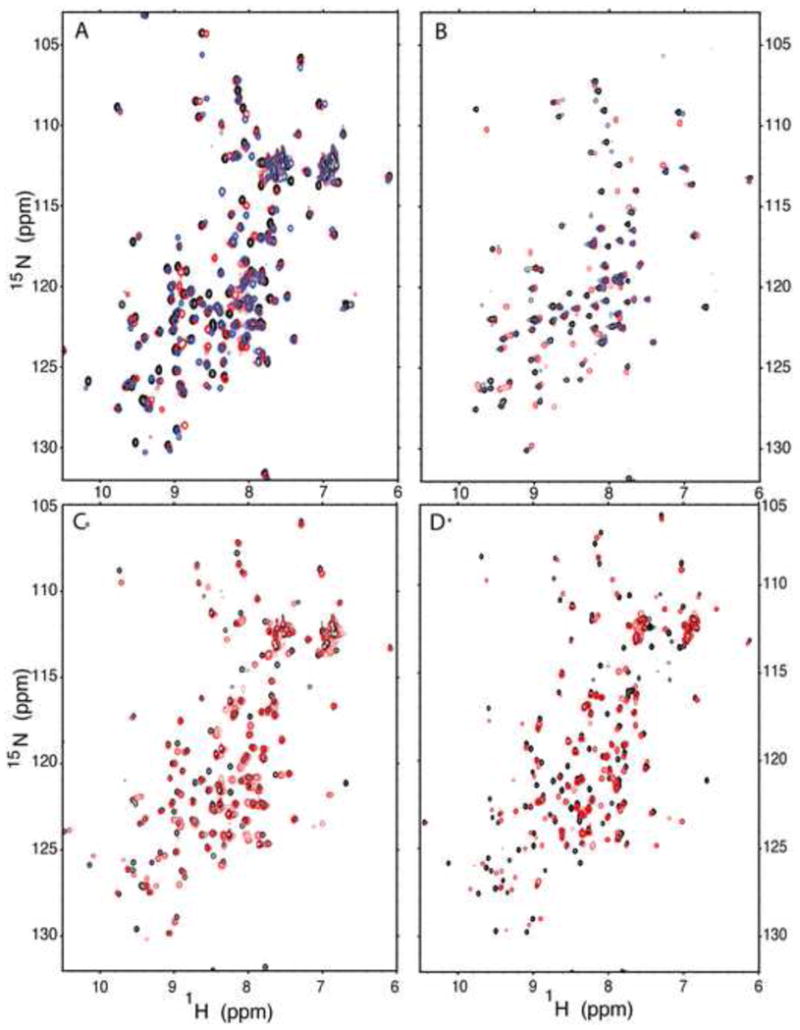
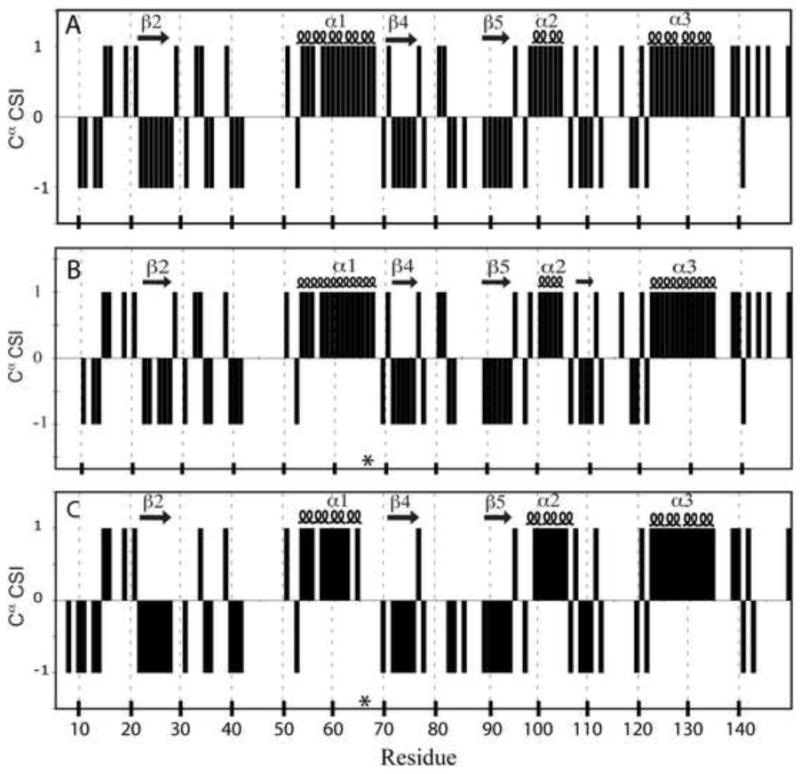
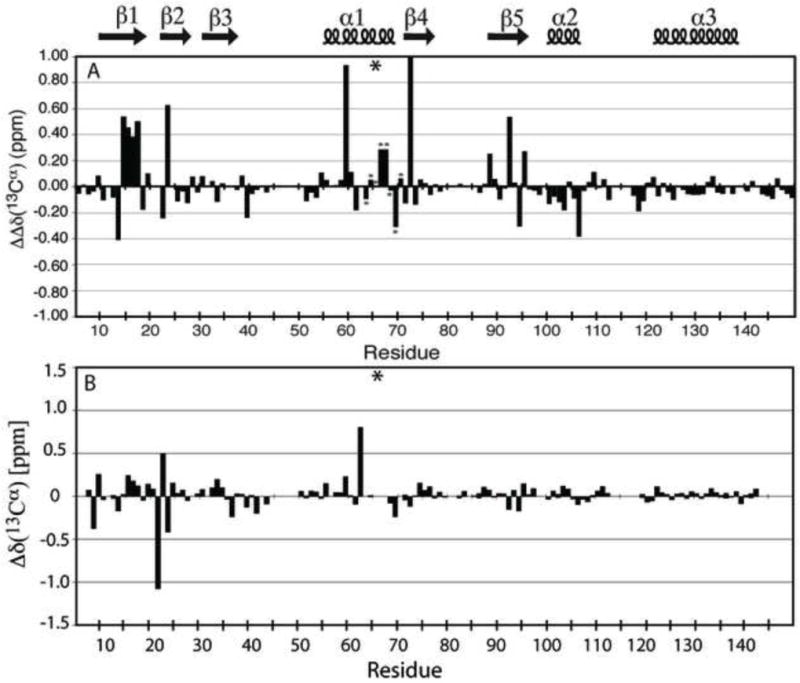
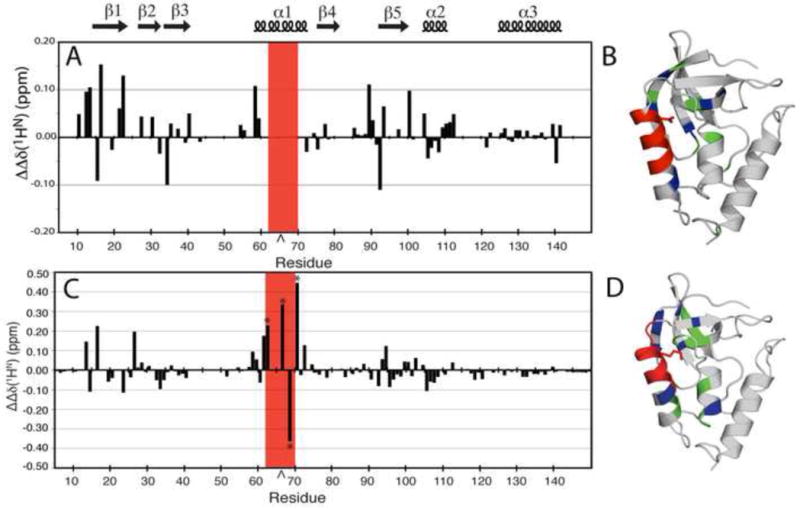
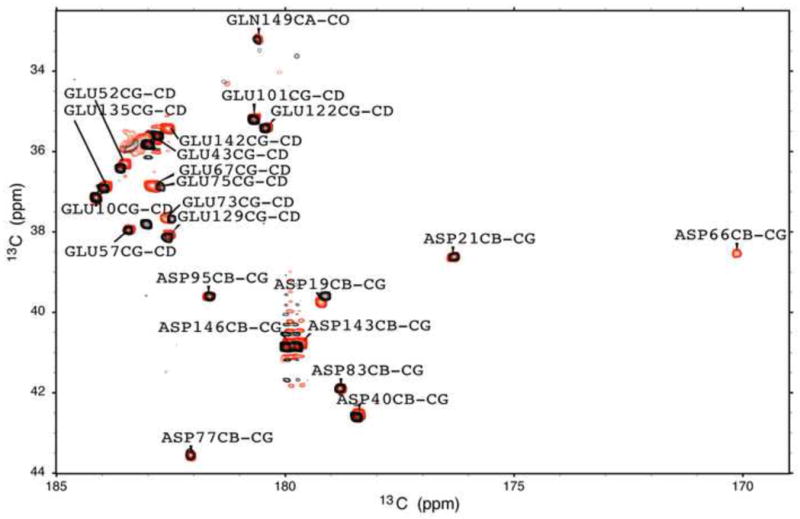
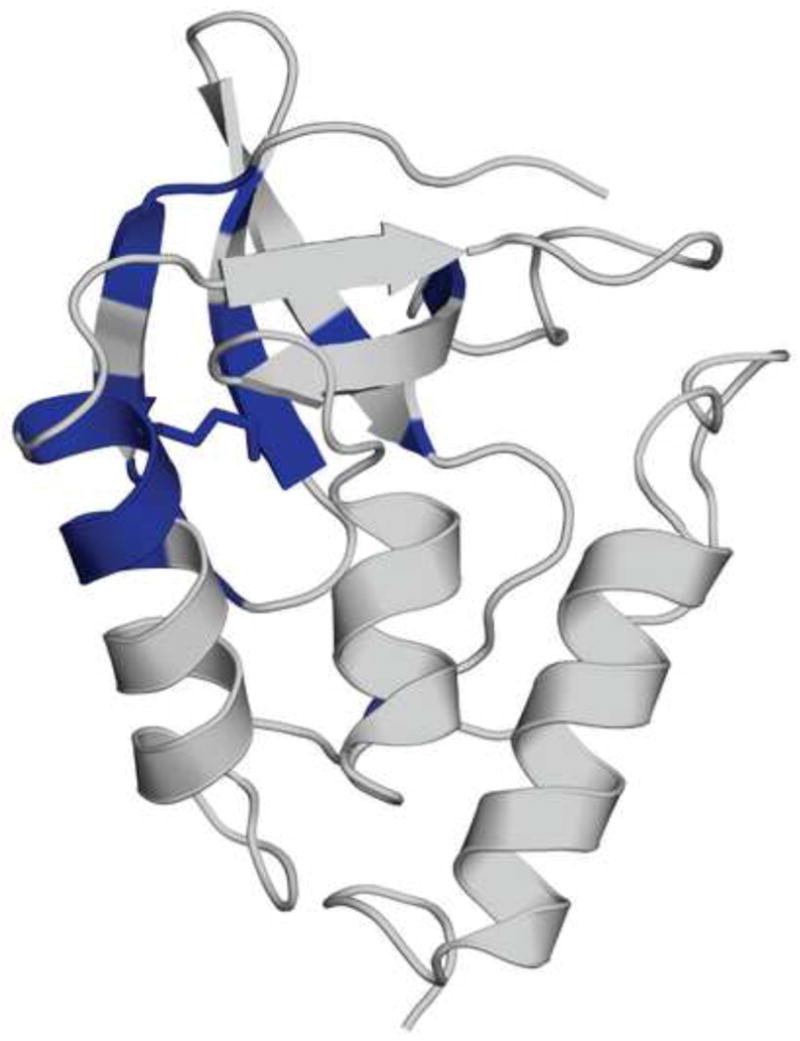
The side chains of Lys66, Asp66, and Glu66 in staphylococcal nuclease are fully buried and surrounded mainly by hydrophobic matter, except for internal water molecules associated with carboxylic oxygen atoms. These ionizable side chains titrate with pK(a) values of 5.7, 8.8, and 8.9, respectively. To reproduce these pK(a) values with continuum electrostatics calculations, we treated the protein with high dielectric constants. We have examined the structural origins of these high apparent dielectric constants by using NMR spectroscopy to characterize the structural response to the ionization of these internal side chains. Substitution of Val66 with Lys66 and Asp66 led to increased conformational fluctuations of the microenvironments surrounding these groups, even under pH conditions where Lys66 and Asp66 are neutral. When Lys66, Asp66, and Glu66 are charged, the proteins remain almost fully folded, but resonances for a few backbone amides adjacent to the internal ionizable residues are broadened. This suggests that the ionization of the internal groups promotes a local increase in dynamics on the intermediate timescale, consistent with either partial unfolding or increased backbone fluctuations of helix 1 near residue 66, or, less likely, with increased fluctuations of the charged side chains at position 66. These experiments confirm that the high apparent dielectric constants reported by internal Lys66, Asp66, and Glu66 reflect localized changes in conformational fluctuations without incurring detectable global structural reorganization. To improve structure-based pK(a) calculations in proteins, we will need to learn how to treat this coupling between ionization of internal groups and local changes in conformational fluctuations explicitly.


Figures

Figure 1
Figure 1
Structure of the Δ+PHS protein. Position 66 is at the interface of α helix-1 and the β-barrel. The side chains of Asp-66 (PDB accession code 2oxp), Glu-66 (PDB accession code 1u9r), and Lys-66 (PDB accession code 2snm), as observed in the crystal structures in which these groups are present, are shown.
Figure 2
Figure 2
(A) Overlay of 1H, 15N HSQC spectra for Δ+PHS/V66D at pH 7.9 (red), Δ+PHS/V66E at pH 7.8 (blue), and Δ+PHS at pH 7.8 (black). (B) Overlay of 1H, 15N HSQC spectra for Δ+PHS/V66D at pH 10.1 (red), Δ+PHS/V66E at pH 9.7 (blue), and Δ+PHS at pH 10.0 (black). (C) Overlay of the 1H, 15N HSQC spectra of Δ+PHS/V66K at pH 6.7 (red) and Δ+PHS at pH 7 (black). (D) Overlay of the 1H, 15N HSQC spectra of Δ+PHS/V66K at pH 4.7 (red) and Δ+PHS at pH 4.7 (black). All spectra were acquired at 25°C and 100 mM NaCl. Contours have been set to normalize the spectra with respect to each other for ease of visualization.
Figure 3
Figure 3
Chemical shift index (CSI) of 13Cα plotted by residue at for (A) Δ+PHS at pH 6.7, (B) Δ+PHS/V66K at pH 6.7, and (C) Δ+PHS/V66D at pH 7.9. Secondary structure elements identified by the analysis are shown above each plot. The asterisk indicates the site of the substitution.
Figure 4
Figure 4
(A) ΔΔδ(13Cα) (ppm) chemical shift difference between Δ+PHS/V66K at pH 6.7 and pH 4.6. The asterisks within the plot identify chemical shift data at 32°C. The asterisk above the plot indicates the site of the V66K substitution. (B) Δδ(13Cα) (ppm) chemical shift difference between Δ+PHS/V66D at pH 6.7 and Δ+PHS at pH 6.8 plotted by residue. The asterisk indicates the site of the V66D substitution.
Figure 5
Figure 5
(A) ΔΔδ(1HN) plotted by residue for Δ+PHS/V66D at pH 7.9 and 9.9. This represents the difference in changes in the 1H, 15N HSQC spectrum of the reference protein, Δ+PHS, at pH 7.9 and 9.9, and the Δ+PHS/V66D variant. The caret indicates the site of the substitution. The red box indicates resonances that were broadened in the mutant but not in the background by increasing pH. (B) Structural distribution of the largest ΔΔδ(1HN) (≥ 0.1 ppm) (blue) and moderate ΔΔδ(1HN) (≥ 0.05 and < 0.1 ppm) (green). Exchange broadened resonances (red) in the Δ+PHS/V66D structure. (C) ΔΔδ(1HN) plotted by residue for Δ+PHS/V66K at pH 6.7 and 4.6. This represents the difference in changes in the 1H, 15N HSQC spectrum of the background protein, Δ+PHS and its V66K variant, between the two pH values. The asterisks identify resonances recorded at 32°C. The caret indicates the site of the substitution. (D) Structural distribution of the largest ΔΔδ(1HN) (≥ 0.1 ppm) (blue), and moderate ΔΔδ(1HN) (≥ 0.05 ppm and < 0.1 ppm) (green) in the Δ+PHS/V66K structure. Upon ionization of Lys-66, positions 62–70 exhibit extreme line-broadening (red). Within this broadened subset, very large ⊗⊗δ(1HN) values (> ±0.2 ppm) were measured at positions 62, 66, 68, and 70.
Figure 6
Figure 6
The two-dimensional [13C] CβCγ(CO) spectra of Δ+PHS (black) and Δ+PHS/V66D (red) at pH 5.0. Labels indicate peaks in the V66D spectrum.
Figure 7
Figure 7
Summary of hydrogen exchange studies. Structural distribution of residues that are fully exchanged (blue) in ⊗+PHS/V66K at pH* 6.9 and time zero, but are not fully exchanged in ⊗+PHS under the same conditions.

References

    1. Lanyi JK, Luecke H. Bacteriorhodopsin. Current Opinion in Structural Biology. 2001;11:415–419. - PubMed
    1. Rastogi VK, Girvin ME. Structural changes linked to proton translocation by subunit c of the ATP synthase. Nature. 1999;402:263–268. - PubMed
    1. Xie AH, Kelemen L, Hendriks J, White BJ, Hellingwerf KJ, Hoff WD. Formation of a new buried charge drives a large-amplitude protein quake in photoreceptor activation. Biochemistry. 2001;40:1510–1517. - PubMed
    1. Deisenhofer J, Epp O, Miki K, Huber R, Michel H. Structure of the protein subunits in the photosynthetic reaction centre of Rhodopseudomonas viridis at 3[angst] resolution. Nature. 1985;318:618–624. - PubMed
    1. Abramson J, Smirnova I, Kasho V, Verner G, Kaback HR, Iwata S. Structure and Mechanism of the Lactose Permease of Escherichia coli. Science. 2003;301:610. - PubMed

Publication types

LinkOut - more resources