Review
. 2011 Aug;1814(8):942-68.
doi: 10.1016/j.bbapap.2010.10.012. Epub 2010 Nov 6.

An introduction to NMR-based approaches for measuring protein dynamics

Affiliations
Review

An introduction to NMR-based approaches for measuring protein dynamics

Ian R Kleckner et al. Biochim Biophys Acta. 2011 Aug.

Abstract

Proteins are inherently flexible at ambient temperature. At equilibrium, they are characterized by a set of conformations that undergo continuous exchange within a hierarchy of spatial and temporal scales ranging from nanometers to micrometers and femtoseconds to hours. Dynamic properties of proteins are essential for describing the structural bases of their biological functions including catalysis, binding, regulation and cellular structure. Nuclear magnetic resonance (NMR) spectroscopy represents a powerful technique for measuring these essential features of proteins. Here we provide an introduction to NMR-based approaches for studying protein dynamics, highlighting eight distinct methods with recent examples, contextualized within a common experimental and analytical framework. The selected methods are (1) Real-time NMR, (2) Exchange spectroscopy, (3) Lineshape analysis, (4) CPMG relaxation dispersion, (5) Rotating frame relaxation dispersion, (6) Nuclear spin relaxation, (7) Residual dipolar coupling, (8) Paramagnetic relaxation enhancement. This article is part of a Special Issue entitled: Protein Dynamics: Experimental and Computational Approaches.


Figures

Figure 1
Figure 1
Proteins sample a range of thermodynamically accessible conformations within a hierarchy of timescales owing to their intrinsic flexibility. The ~20 minima correspond to defined states with finite populations. The population of each state is determined by its relative free energy, while interconversion rates are determined by inter-state energy barriers. An ensemble of states comprises all the individual states within its defined time window. Although these time windows are best understood to lie along a continuum, they have been grouped into ps, ns, μs-ms and sec for clarity. To describe the “structure” of a protein it is important to recognize that its conformation will be time-averaged within the time window and ensemble-averaged within the set of molecules under observation. Note that the shape of this landscape is unique for each protein and may change with conditions (e.g., temperature, pressure, pH, ionic strength, ligand binding).
Figure 2
Figure 2
The free induction decay (FID) is the fundamental NMR observable and encapsulates the individual signals from each site-specific probe in the molecule. This time-dependent signal (left) is Fourier transformed into the frequency domain (right) for quantification of the three primary NMR observables: (1) frequency (or chemical shift δ) is the position of the peak in the spectrum and reports on local chemical environment, (2) intensity I can be quantified by peak height or peak area and reports on populations and (3) linewidth λ is the full peak width at half maximum height and reports on local dynamics via the relaxation rate R2 = 1/T2. Note that the more rapidly relaxing signal (B) is shorter and broader than (A) yet the total area under the peak is conserved because they are simulated with identical intensities. The differences in linewidths of individual signals can be used to discern site-specific differences in protein dynamics.
Figure 3
Figure 3
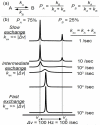
Chemical exchange processes (including protein dynamics) directly alter the three primary NMR observables. (a) Exchange between two states A and B can be described by their rates of departure kA and kB and chemical shifts νA and νB. kex is the total exchange rate and PA and PB are the population fractions of each state (PA + PB = 1). (b) The effect of varying kex on NMR spectra with PA = 75% and Δν = 100 Hz. Note that the time regime of chemical exchange is defined by the relative magnitudes of kex and Δν (each in units of Hz = /sec;see beginning of section 2.2 for details on units). In the slow exchange regime (kex << |Δν|), signals from both states are observed reflecting their distinct chemical shifts, intensities and linewidths. In the fast exchange regime (kex >> |Δν|), only one signal is observed reflecting the population-weighted averages of chemical shift, intensity and linewidth. In the intermediate exchange regime (kex ≈ |Δν|), only one signal is observed with intermediate chemical shift. Importantly, the linewidth is increased via “exchange broadening” which can sometimes render this signal undetectable. In each case, the signal linewidths reflect the local dynamics of the sites and the rate of their interconversion. Adapted from [42].
Figure 4
Figure 4
Four essential steps to any NMR experiment. (1) The Recovery period permits restoration of equilibrium magnetization used for detection. (2) The Preparation period is used to select the nucleus and quantum magnetization of interest. (3) The Evolution period incorporates incremented time delays to permit detection of chemical shift in additional frequency dimensions and/or to permit evolution of relaxation in dynamics experiments. (4) The detection period directly observes the FID, which encapsulates the effects of the first three steps. The four steps are typically repeated ~2-32 times to increase the signal to noise ratio via signal averaging. Experiments for measuring dynamics employ a relaxation delay during the evolution period in order to record the decay or buildup of magnetization.
Figure 5
Figure 5
Protein conformational changes over a broad range of timescales enable their biological function. These dynamic processes can be studied with a variety of NMR methods, eight of which are discussed in this review in the following order: (1) Real Time NMR, RT NMR; (2) EXchange SpectroscopY, EXSY (also known as zz-exchange); (3) Lineshape analysis; (4) Carr-Purcell Meiboom-Gill Relaxation Dispersion, CPMG RD; (5) Rotating Frame Relaxation Dispersion, RF RD; (6) Nuclear Spin Relaxation, NSR; (7) Residual Dipolar Coupling, RDC; (8) Paramagnetic Relaxation Enhancement, PRE.
Figure 6
Figure 6
Real-time NMR reports on interconversion between two species by direct detection of their respective signals. (a) After initiating conversion of A→B, a sequence of NMR spectra are recorded in rapid succession with signals from A and B at chemical shifts νA and νB respectively. (b) The time course of signal intensities can be used to quantify the rate of conversion towards equilibrium.
Figure 7
Figure 7
Folding rate of α-lactalbumin from the molten globule state (MG) monitored by Real-Time NMR. (a) 2D NMR spectra acquired before, upon initiation and 120 sec after pH-induced folding reveal site-specific changes in local structure. (b) Time-dependence of signal intensity for V91 in the folded state and for an unassigned peak in the MG state fit to a single exponential model. (c) The sequence map of individual time constants for the folding process is consistent with global folding at a uniform rate (i.e., no intermediates or local effects). Adapted with permission from [73], copyright 2007 National Academy of Sciences, U.S.A..
Figure 8
Figure 8
HDX NMR indicates the Opj mutation of the protein γS crystallin induces selective destabilization of its amino-terminal (NT) domain. Vertical bars indicate ΔGop for the dynamic equilibrium between open and closed states of each amide in the WT protein obtained from fitting site-specific amide proton exchange rates in the EX2 regime. Dots indicate the effect of the mutation on the stability of each residue with positive values indicating destabilization. The Opj mutation reduces the WT ΔGOp by an amount (ΔGWT − ΔGOpj) = ~1-3 kcal/mol in the NT domain and ~0 kcal/mol in the CT domain. Data courtesy of Zhengrong (Justin) Wu (OSU, personal communication).
Figure 9
Figure 9
The EXSY experiment is used to quantify exchange kinetics for structural probes in the slow exchange regime (kex << Δν). (a) Each structural probe in each molecule is labeled with its chemical shift A or νB) before and after exchange time T to determine the extent of A↔B interconversion. The resulting NMR spectrum yields up to four signals per exchanging structural probe with intensities modulated in a exchange-time-dependent manner. If a 1H is exchanging between states A and B with chemical shifts νA and νB, exchange crosspeaks will be observed at frequencies (νAB) and (νBA). (b) The exchange-time-dependent intensities (“build up curves”) can be fit to a model of A↔B exchange to define exchange rates kA and kB. In the simplified case shown here in which R1A = R1B and R2A = R2B the A→B and B→A signals provide identical information. The intensities of the AA diagonal peaks from the four spectra in (a) are marked with gray arrows.
Figure 10
Figure 10
1H-1H 2D EXSY spectrum at T = 0.5 sec of the α annulus of the 20S proteasome core particle reveals three-state exchange (A↔B↔C) for methyl probes from two methionione residues (“-1” and “1”). (Top) The signals along the diagonal of the spectrum arise from two non-exchanging methionine residues (M6 and M40) and the three exchanging states of M-1 and M1 (A, B and C). Crosspeaks result from exchange between states during the 0.5 sec exchange time. There are 10 such signals resulting from the M-1 and M1 conversions A→B, A→C, B→A, B→C, C→A and C→B (note: M1 B→C and C→B are not observed). The two horizontal cross-sections of the two-dimensional spectrum at δ(1H) = 2.05 ppm, recorded at T = 0 and T = 0.5 sec indicate the M-1 A→B and M-1 A→C signals result from exchange as they are absent in the T = 0 sec trace. (Bottom) The build-up curves are used to determine exchange rate constants and thus inform on the time-dependent structure of the proteasome gate. Adapted from [83].
Figure 11
Figure 11
NMR line shape analysis can be used to study protein-ligand interactions, P + L ↔ PL, by acquiring multiple NMR spectra along a [P] / [L] titration coordinate. The exchange regime (slow, intermediate or fast) is strongly affected by ligand binding affinity, KA=[PL][P][L]=konkoff because a tighter-binding complex yields a longer-lived bound state and hence slower exchange between the free and bound states. (a) Tight binding yields slow exchange because the protein-ligand complex is long-lived and rarely dissociates during the detection period of the NMR experiment. (b) Intermediate exchange results from intermediate binding due to significant interconversion between the free and bound states during the detection period of the NMR experiment. (c) Fast exchange results from weak binding because there is extremely rapid interconversion (and hence averaging) during the detection period of the experiment. Adapted from [43].
Figure 12
Figure 12
NMR lineshape analyses reveal transient population of intermediates in SH2 domain-ligand interactions. (a) The amide nitrogen of Ser339 in the wild-type (WT) SH2 reports ligand binding in a simple two-state mechanism with signals arising from the free (P) and bound (PL) protein. (b) The same probe (Ser339) on SH2 mutant P395S reveals population of an intermediate state (P*L) and a more complex binding mechanism. The arrow marks a shoulder that reflects fast exchange between the P*L and PL states. (c) Ile383 on mutant P395S reveals a set of intermediates via titration lineshapes that are too complex to be quantitatively interpreted. Adapted from [104].
Figure 13
Figure 13
The spin-echo pulse element τ-180x,y serves to refocus magnetization independent of chemical shift. During the first time τ, magnetization of NMR resonances A and B evolve in the x,y-plane under the influence of chemical shifts ωA and ωB as evidenced by clockwise rotation about the B0 field (+z-axis, pointing out of the page). In this example, ωA and ωB differ for the two resonances and hence their net phases φA and φB differ at the end of τ via φ(t) = ωt. The 180° pulse along −x flips the magnetization, negating the net phases of A and B. Finally, after evolution for a second period τ, both resonances return to the +x-axis simultaneously (φ(2τ) = 0) despite their chemical shift difference: they are “refocused”. Importantly, if due to exchange, the average chemical shift <ω> for a single spin differs in the two τ periods (i.e., if τ1> ≠ <ωτ2> via exchange), it will not return to +x at t = 2τ and hence the set of magnetization vectors will not be refocused completely.
Figure 14
Figure 14
Carr-Purcell Meiboom-Gill Relaxation Dispersion (CPMG RD) uses spin-echo pulse trains to suppress relaxation due to exchange processes on the μs-ms timescale. (a) The number of spin-echo pulses applied during the fixed relaxation time directly determines the CPMG frequency via νCPMG = 1 / (4τ). The applied CPMG pulse train is shown above each relaxation delay (νCPMG = 100, 500 and 1100 Hz). These pulses reduce the signal relaxation rate during the relaxation delay by refocusing exchange broadening (i.e., reducing Rex). (b) The observed signal intensity remaining at the end of the TCPMG relaxation delay is used to obtain an effective relaxation rate R2Obs(vCPMG)=In(I(vCPMG)I0)TCPMG, where I0 is the signal intensity in the absence of the relaxation delay (i.e., when TCPMG = 0). (c) The dispersion curve reports on dynamics by plotting relaxation rate as a function of refocusing frequency. R2Obs is altered in a νCPMG-frequency-dependent manner such that significant refocusing is typically achieved when νCPMG exceeds half the exchange rate kex. The observed relationship between site-specific R2Obs and νCPMG is used to fit an exchange model described by the chemical shift differences between the exchanging states Δν, population fraction of the A state PA with PA + PB = 1, total exchange rate between the states kex = kA + kB, and the intrinsic relaxation rate in the absence of exchange R20, which can be used to determine the exchange broadening Rex. This dispersion curve is simulated using Δν = 400 Hz, PA = 90%, kex = 400 /sec and R20 = 10 Hz with the three νCPMG values from (a) and (b) marked with vertical arrows. Note that the R2Obs curve begins to “break” at νCPMG = kex / 2 = 200 /sec.
Figure 15
Figure 15
CPMG RD experiments reveal dynamic “memory” in the catalytic cycle of dihydrofolate reductatse (DHFR). The DHFR catalytic cycle involves five ground-state structures to catalyze conversion of DHF to THF. CPMG RD experiments probing μs-ms flexibility indicate that each ground state samples a structure similar to the adjacent state in the catalytic cycle. This is evidenced by correlation between dynamic Δω values obtained from fitting CPMG RD data on each state in the cycle and structural Δδ values comparing local conformational differences between states in the cycle. For each correlation, the CPMG Δω data plotted are connected to the state from which they arise via dashed gray line and structural Δδ data via solid black line. For clarity this is explicitly labeled for the E:NADPH:THF state in the lower left. These observations invite the hypothesis that the motions of DHFR enable its biological function by allowing it to sample the adjacent states at each step in the cycle. Adapted from [120].
Figure 16
Figure 16
CPMG RD identifies three groups of independent motions in the structure of FRE-FAD with distinct dynamic motions and biological implications. (Left) The (kA,kB) plot validates the segregation of site-specific probes into one of three distinct groups. Each point on the plot results from simulations used to estimate fitting errors. Because the three groups of points are well-separated, the uncertainty in fitting the data is much less than the differences in dynamic motions exhibited by the groups. (Right) The three groups are mapped to the structure of FRE-FAD. Group 1 appears to undergo a local unfolding process evidenced by enthalpy change ΔH > 0 and magnitude of chemical shift differences |ΔωN| while groups 2 and 3 directly affect the electron transfer rate in the enzyme due to their proximity to FAD cofactor. Adapted with permission from [115], copyright 2006 National Academy of Sciences, U.S.A.
Figure 17
Figure 17
Effective field Beff arising from the combination of the static magnetic field B0 and a transient radio frequency (RF) pulse B1 applied to a spin with a frequency offset Ω from the carrier frequency ωRF. (a) An RF pulse has three primary characteristics: (1) carrier frequency ωRF, (2) amplitude B1 and (3) phase φ. Selective excitation is possible because the combination of B1 field and static B0 field produce a frequency-dependent field with a magnitude Beff=(ω1γ)2+(Ωγ)2, and orientation that is tilted an angle θ = tan−1(ω1) from the static field B0. (b) The difference in nuclear precession frequency ω0 and RF carrier frequency ωRF is denoted the resonance offset Ω = ω0 − ωRF. Note that both magnitude and orientation of Beff may differ for each structural probe since they both depend on the site-specific chemical shift ω0 via resonance offset Ω = ω0 − ωRF.
Figure 18
Figure 18
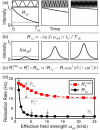
Rotating frame relaxation dispersion (RF RD) uses spin-lock pulses to suppress relaxation due to exchange processes on the μs timescale. (a) The effective field strength ωeff can be increased by increasing ω1 while keeping ωRF (and therefore Ω) fixed (“near/on resonance”) or by increasing Ω (by changing ωRF) while keeping ω1 fixed (“off resonance”). The applied spin-lock field is shown above each relaxation delay (ωeff = 1, 5 and 10 kHz). This field reduces the signal relaxation rate during the relaxation delay by refocusing exchange broadening (i.e., reducing Rex). (b) The observed signal intensity remaining at the end of the TSL relaxation delay is used to obtain a rotating-frame relaxation rate R1ρ (ωeff )= − ln(I(ωeff ) / I0 ) / TSL , where I0 is the signal intensity in the absence of relaxation delay (i.e., when TSL = 0). (c) The laboratory frame transverse relaxation rate R2Obs is actually the quantity of interest and can be determined using the known values of offset, Ω = ω0ωRF, the rotating frame tilt angle, θ = tan−1(ω1 / Ω), and a site-specific measure of the longitudinal relaxation rate R1 by using the relation R2Obs=R20+Rex=(R1ρR1cos2(θ))sin2(θ). (d) The dispersion curve reports on dynamics by plotting relaxation rate as a function of refocusing frequency. R2Obs is altered in a frequency-dependent manner such that significant refocusing is typically achieved when ωeff exceeds half the exchange rate kex. The observed relationship between site-specific R2Obs and ωeff is used to fit an exchange model. This example illustrates the off-resonance approach whereby ω1 is fixed at 1 kHz and ωeff is varied via Ω which is varied from 0 to 25 kHz by altering the RF carrier frequency ωRF. The exchange parameters used are R1 = 1 Hz, R20 = 10 Hz, PA = 80%, kex = 5,000 /sec, Δν = 500 Hz (yields Φex = 40,000 Hz2) with the three ωeff values from (a) and (b) marked with vertical arrows.
Figure 19
Figure 19
RF RD reveals differential site-specific changes in backbone 15N and side chain 13C dynamics of the protein FKBP12 upon binding the drug FK506. (a, b) The backbone 15N of Ala81 exhibits reduced R2 relaxation (exchange broadening) upon drug binding (Rex ~10 Hz → 0 Hz). This is consistent with rigidification of the local structure at the μs timescale. (c, d) In contrast, the side chain β-13C of the same residue exhibits increased exchange broadening (Rex ~2 Hz → 4 Hz). Importantly, a global fit of all sites in the structure reports an increase in exchange rate kex from 8,000 to 14,000 /sec upon drug binding. (Right) The magnitude of motions in the free protein are mapped onto the structure via the site-specific Δωmin (15N) from RD fits. Similarly, the structural changes induced upon drug-binding are shown via site-specific chemical shift perturbations Δδ(15N) from NMR spectra. This is consistent with a model in which drug binding alters the structure of FKBP12, rigidifying the backbone while increasing flexibility of the side chains. Adapted from [156].
Figure 20
Figure 20
Molecular motion at the ps-ns timescale is indirectly detected via nuclear spin relaxation (NSR). NSR is stimulated by MHz-frequency oscillating magnetic fields arising from (i) dipole-dipole (DD) interactions, (ii) chemical shift anisotropy (CSA) and (iii) quadrupolar interactions due to reorientation of bonds from (a) molecular rotation (tumbling on the ns timescale) with respect to the static B0 field, and (b) site-specific internal motions on the ps timescale. (c) The site-specific NMR observables related to NSR include the longitudinal recovery rate R1, the transverse relaxation rate R2 and the heteronuclear NOE. (d) These observables can constrain a model of global and internal motion at the ps-ns timescale. This is often interpreted via the modelfree or reduced spectral density mapping approach, either of which can be used to describe restricted motion of each bond vector within a cone of angle θ (larger S2 → smaller θ) with intra-cone diffusion rate via τe and the molecular rotational diffusion time τm via diffusion tensor elements (Dxx, Dyy, Dzz) shown in (a).
Figure 21
Figure 21
NSR and modelfree analyses indicate that DNA binding decreases ps-ns flexibility for effector-bound WT CAP, but increases flexibility for effector-bound S62F CAP. Calorimetry experiments corroborate this finding at a global level by indicating that DNA binding is driven by enthalpy ΔH for WT CAP but by entropy ΔS for S62F CAP. (a,b) Site-specific rigidity and its change upon DNA-binding are mapped to the sequence via the order parameter S2(Free) as vertical bars and the change in S2, ΔS2 = S2(+DNA) − S2(Free), as dots for WT (a) and S62F (b). Negative values of ΔS2 indicate regions of the S62F protein that become more flexible upon binding DNA, especially in the cAMP binding site (red arrow). This provides high-resolution mechanistic details of the dynamic linkage between the cAMP site and the DNA site. The cAMP site includes about half the residues between 60-85 and the DNA site includes about half the residues between 165-200 (within 5Å of crystal structure PDB ID 1CGP) [118]. Data courtesy of Charalampos (Babis) Kalodimos (Rutgers Univ., personal communication).
Figure 22
Figure 22
Molecular motion at the ps-ms timescale is indirectly detected via residual dipolar couplings (RDCs). (a,b) RDCs are affected by (i) non-uniform sampling of molecular orientations (i.e., anisotropic rotation) with respect to the magnetic field B0, (ii) site-specific orientations of each bond vector with respect to the molecule and (iii) site-specific ps-ms motions of each bond vector with respect to the molecule. (c) To extract the dynamic information, the site-specific RDCs are measured using a non-decoupled NMR spectrum which splits each signal by an amount J+RDC. Each of at least five orthogonal alignment media yield unique alignment tensors and potentially unique values of the RDC splitting. All RDC data are analyzed together by (1) fitting a unique alignment tensor S = (Sxx, Syy, Szz) shown in (a) for each alignment medium, (2) fitting a site-specific ps-ms order parameter S2RDC for all alignment media and (3) obtaining site-specific bond vector orientations (θii) with respect to the molecular frame shown in (b) used for all alignment media. The (θii) values are obtained from a high-resolution structural model. (d) This can be used to describe restricted motion of each bond vector within a cone of angle θ (larger S2RDC → smaller θ) sampled within the ps-ms time window.
Figure 23
Figure 23
RDCs reveal ps-ms dynamics of ubiquitin apparently related to the conformational selection during target binding. (a) Site-specific order parameters from the RDC EROS ensemble S2RDC probe ps-ms rigidity. Subtraction of order parameters from nuclear spin relaxation S2NSR (ps-ns) reveals negative values reflecting flexibility in the previously unprobed “supra-τc” (ns-ms) time window. The average value of S2RDC −S2NXR (−0.07) is marked with a horizontal dashed gray line. (b) S2RDC -S2NSR values less than the average are colored gold on the structure of ubiquitin to indicate ns-ms flexibility. This flexibility is mostly limited to the loops whereas the α helices and β strands are rigid in this time window. Some regions including the NT end of β2 are coincident with the gray spheres representing contacting atoms from target proteins in complex with ubiquitin observed via crystallography. Consequently, the ns-ms flexibility at these key locations may enhance the conformational selection mechanism of ubiquitin for its many binding partners. Overall, inclusion of RDC data improve temporal coverage in studies of protein motions and are important to help address the linkage of structure, dynamics and function [184, 202]. Data courtesy of Oliver Lange, Bert de Groot and Christian Griesinger (Max Planck Inst., personal communication).
Figure 24
Figure 24
Intermolecular PREs indicate non-nonspecific encounters between the proteins EIN and HPr. (a) Site-specific 1HN Γ2 rates of EIN result from both specific and non-specific contacts with PRE-labeled HPr and are shown as red dots. The contributions from specific contacts are calculated using a high-resolution structural model of the stereospecific EIN-HPr complex and are shown as a black line. Observed values of Γ2 that exceed the calculated values result from one or more transiently populated non-specific binding modes. (b) The points of non-specific contact between EIN and HPr are shown in gold. Based on the Γ2 data in (a), these residues are 25-75, 100-110 and 190-200. These data reveal the nature of non-specific encounter complexes between EIN and HPr that describe how the proteins encounter one another in solution [191]. Data courtesy of Chun Tang (U. Missouri, personal communication).

References

    1. Henzler-Wildman K, Kern D. Dynamic personalities of proteins. Nature. 2007:964–972. - PubMed
    1. Boehr DD, Dyson HJ, Wright PE. An nmr perspective on enzyme dynamics. Chem. Rev. 2006:3055–3079. - PubMed
    1. Kamerzell TJ, Middaugh CR. The complex inter-relationships between protein flexibility and stability. J Pharm Sci. 2008:3494–3517. - PubMed
    1. Namanja AT, Wang XJ, Xu B, Mercedes-Camacho AY, Wilson BD, Wilson KA, Etzkorn FA, Peng JW. Toward flexibility-activity relationships by nmr spectroscopy: dynamics of pin1 ligands. J. Am. Chem. Soc. 2010:5607–5609. - PMC - PubMed
    1. Loria JP, Berlow RB, Watt ED. Characterization of enzyme motions by solution nmr relaxation dispersion. Acc. Chem. Res. 2008:214–221. - PubMed

MeSH terms

LinkOut - more resources